CityDashBoard TalesofThings MapTube
Qrator Tutorials About Digital Urban
MRes ASAV SurveyMapper Contact Us
Showing posts with label Twitter. Show all posts

2012-01-25

London Twitter Data as a Landscape

Readers will know that as part of the MRes in Advanced Spatial Analysis and Visualisation, here in CASA, we are exploring new methods and techniques for visualising data. As part of the course we are looking at collecting data from the Twitter API and using the resulting .csv file as an input into a variety of software, including Processing and ArcMap. Data so far has been focused on displaying the output from ArcGIS as a slightly more traditional map, albeit in 3D via Lumion:


Taking a step back it is possible to take a more abstract view of the data visualisation and use the Twitter data collected to create a digital elevation model for direct landscape visualisations.


As we have mentioned in previous posts there are of course many arguments on the pro's and con's of visualising data in such a way, indeed the visualisation is developed to open up the debate as part of the MRes course allowing various visualisation techniques to be compared from the same data set. 


Sometimes however an abstract route to visualising data can quite liberating in a world of visualisation dominated by more traditional and academic output, the screenshot above illustrates Kingston Peak with Soho Mountain dominating the background. The movie below details the landscape as a fly-through:


In future posts we will explore issues of scale as we take the landscape and move it into an online exhibition space.


Update  - see Data Space: Agent Based Models, SketchUp, Visualisation, ArcGIS and Lumion for the exhibition space developments...

2012-01-21

London's Twitter Island - From ArcGIS to Max to Lumion

As part of the MRes in Advanced Spatial Analysis and Visualisation, here in CASA at The Bartlett, University College London, we are exploring new methods and techniques for visualising data. As part of the course we are looking at collecting data from the Twitter API and using the resulting .csv file as an input into a variety of software, including Processing and ArcMap.

One such known example is the London Twitter map by UrbanTick, developed using the data collector created by Steven Gray and imported by Fabian into ArcMap, it developed a style of its own as the 'NewCity Landscape' collection. From a digital urban point of view the next stage of the map is a 3D extension, a transformation that proved surprisingly difficult due to the nature of combining the worlds of traditional GIS and game engines such as Lumion.

We are still in the early stages of development but the movie below illustrates the NewCity Landscape Map of London visualisation in Lumion as a 'Twitter Island':


Music by Pigeman over at MP3 Unsigned. There are of course many arguments on the pro's and con's of visualising data in such a way, indeed the visualisation is developed to open up the debate as part of the MRes course allowing various visualisation techniques to be compared from the same data set.

We will have more updates as the visualisation develops, along with a walk through of how to build it. If your interested in such output our MRes is now open for applications, entry 2012-2013...

2010-09-17

San Francisco Tweetography: Twitter Landscapes

Our geo-located twitter data mined from San Francisco has now been processed to create a new look at the city.

Processed by Fabian Neuhaus, a PhD student here at CASA, University College London, the new city twitter topography creates a unique new media landscape. The data is mined via our 'Tweet-O-Meter' system (soon to be seen in physical form in the British Library) which collects all geo-located tweets within a 30km radius of world cities.


You can view a full screen Google Maps style version of San Francisco over at Urban Tick as well as the previous maps of London, New York, Munich, Paris and Moscow.

2010-08-04

Invisible, Hidden, Parallel Cities: Twitter Landscapes

By revealing the social networks present within the urban environment, Invisible Cities describes a new kind of city—a city of the mind. The movie below by Christian Marc Schmidt displays geocoded activity from online services such as Twitter and Flickr, both in real-time and in aggregate. Real-time activity is represented as individual nodes that appear whenever a message or image is posted. Aggregate activity is reflected in the underlying terrain: over time, the landscape warps as data is accrued, creating hills and valleys representing areas with high and low densities of data.

In the piece, nodes are connected by narrative threads, based on themes emerging from the overlaid information. These pathways create dense meta-networks of meaning, blanketing the terrain and connecting disparate areas of the city:


Invisible Cities maps information from one realm—online social networks—to another: an immersive, three dimensional space. In doing so, the piece creates a parallel experience to the physical urban environment. The interplay between the aggregate and the real-time recreates the kind of dynamics present within the physical world, where the city is both a vessel for and a product of human activity. It is ultimately a parallel city of intersections, discovery, and memory, and a medium for experiencing the physical environment anew.

Our movie below of London's Tweets displays a similar 'hidden city':


As we posted a few weeks ago, we have been harvesting geospatial data from Twitter with the aim of creating a series of new city maps based on Twitter data. Via a radius of 30km around New York, London, Paris, Munich we have collated the number of Tweets and created our New City Landscape Maps. The maps created by UrbanTick detail the social networking landscaping.


Pictured above is London, below is New York:


UrbanTick has the full run down with New York, London, Paris and Munich, all available in glorious full screen mode via a Google Maps viewer - head over to take a look at the New City Landscapes.

Thanks got to Steven Gray who did the coding and Fabian over at Urban Tick for converting the data into maps. Also thanks to Dr Chris Speed who sent in the invisible cities movie link.

2010-04-26

Tweeting from Conferences - Live Criticism and How to Cope

We write occasionally for the Nature Network, as such we thought readers maybe interested in our latest post on the rise of twitting at events and conferences.

A few weeks ago we presented our latest work 'The Geography of Everything' at the yearly conference organised by the Centre for Advanced Spatial Analysis at University College London. With the work featured in New Scientist and based around a new way of tagging every object in the world via the talesofthings.com site we hoped for a good reception. Indeed the reception was good with an excellent write up in the Guardian and a series of suitably scientific questions fielded and answered. What we were not quite prepared for was the archive of the tweet feed with various audience members 'tweeting' through the event.

Carry on reading over at Urban Nature...

2010-04-21

Making 'Objects' Tweet

You may of noticed that we recently launched our project 'TalesofThings', a site that tags any media to any object using qrcodes or rfid tags:


Once tagged each object basically gets its own webpage allowing comments to be placed, new media added such as YouTube clips, Audioboo, Vimeo etc and new tales tagged to the codes.


An interesting take on this is that once these tags are placed in the wild and scanned with the free iPhone app they become read/writable and therefore location aware. As such any object you tag with the site can 'Tweet' each time it is scanned. If you tag a landmark for example, each time that tag is read you can get a tweet that says 'Hey, I've just been scanned'. Once scanned new tales or comments can be added to that tag, creating a social network of 'things' and 'locations'.

We are working on ways to make the objects more location aware and aware of near by objects, it could be interesting over the next few months to see how this develops. You can see all the things added to far on the 'world of things map':


You can start tagging anything and everything via talesofthings.com

2010-03-17

London Twitter Cloud Updated Movie

An update movie on our data collection via Twitter in association with urbantick. The data covers a weekend period from Friday evening to Monday morning containing 380,000 individual tweets. Within these 60,000 were geo-referenced, tweeted by 5,500 individual users.


The movie clip uses Google Earth to visualise the data:


Music - Becoming Visible by Xanthe on MP3 Unsigned.

Note the 'tweets' at Heathrow and how you can almost pick out London's shape via the twitter cloud alone. The original movie can be found here.

2010-03-09

London Twitter Cloud

Regular readers will know we have been logging data in 12 cities via our Tweet-o-Meter, its still early days but the results for a weekend in London are intriguing.


The data covers a weekend period from Friday evening to Monday morning containing 380,000 individual tweets. Within these 60,000 were geo-referenced, tweeted by 5,500 individual users.

In terms of density the focus is on central London with local hotspots as the weekend progresses, around Kings Cross and Old Street. There is also a noticable trace along the main transport routes into and out of town, noting that we seem to be tweeting while on the move. The clip below details the visualisation in Google Earth:


Music - 'Social Awkwardness' by Xanthe  over on unsigned bands.

The clip reveals a message cloud rising and hovering above London as a time-space aquarium where the time is plotted as the height information. Interestingly Google Earth is becoming the visualiser of choice for such data sets, the combination of location, imagery with the ability to view by time makes it a formidable engine for data visualisation.

Thanks go to urbantick who converted the data via a custom VB script.

2010-02-26

Carling Cup Final Tweet-o-Meter is Live

The Tweet-o-Meter developed here at CASA is now live for the Cup Final Weekend, making it, in the words of Carling, the First Digital Cup final.

The Tweet-O-Meter measures the volume of tweets about the Carling Cup Final and shows who's tweeting hardest; fans in Birmingham, Manchester or London! As Carling states - it's a great way to see where the buzz is in the build-up to, and during, the final.


For your tweets to be measured use #CCF10 and if you're following a particular team add #villa or #manutd. Also, you'll need to geolocation turned on in Twitter to do this...

To enable us to locate your Tweets, login to your Twitter account at www.twitter.com and select "Settings" at the top of the page. In the location setting, check the box next to "Enable geotagging". That’s it! Any message from now on sent via Twitter with the "#ccf10" tag will be caught by our Tweet Meters.


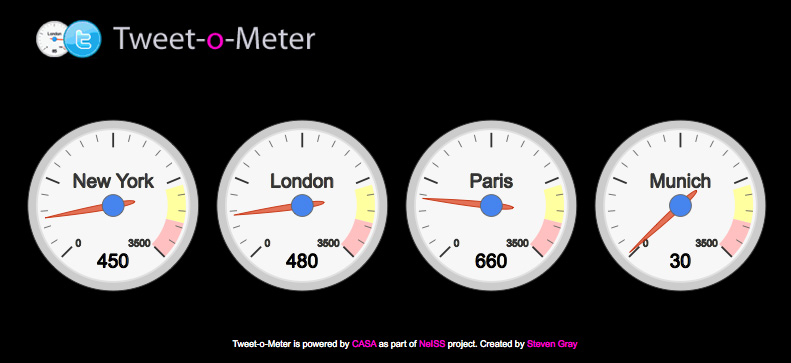
The Tweet-o-Meter system was developed here at CASA, University College London and measures the amount of tweets (measured in Tweets per Minute or TPM) received from various locations around the world. The gauges are updated every second giving you a live view of the TPM's in each location.


There is some serious science behind the Tweet-o-Meter, it is designed to mine data for later analysis relating to furthering our understanding of social and temporal dynamics for e-Social Science within the Twitter demographic. The system is as part of a wider survey tool as part of the NeISS project in association with us here at Digital Urban, with research by Urban Tick and coded by Steven Gray.

View the Carling Tweet-o-Meter.

2010-02-23

Carling Cup Final using Tweet-o-Meter

Part of our remit for e-Science here at CASA and du is to use our research in new and innovative ways to get it out into the field. Indeed thats what the blog is all about, sharing our work and the science/techniques behind it. As such this weekend Carling Carling is positioning this weekend's Carling Cup Final as the "first digital cup final" and is asking fans to take part in the biggest-ever live Twitter commentary during the game using our Tweet-o-Meter.


The Molson Coors lager brand is aiming to get fans talking about the game, which sees Aston Villa take on Manchester United, on the social networking site by using the hash tag #CCF10 and submitting their comments to @thecarlingcup.

The sponsor will track the levels of activity across the social media platform as well as the topics supporters are discussing around the game via a new Tweet-o-Meter, which the brewer has created in partnership with us here at the Centre for Advanced Spatial Analysis, part of the University College London.

Carling brand director, Martin Coyle, says: “Our ambition is always to give fans a bigger voice and get them involved with the competition every step of the way - the great thing about digital activity is that it gives everyone the opportunity to have their say in what should be a superb occasion.

“With all the activity we’ve got lined up on Sunday we genuinely believe that this is the first ever digital cup final. It should be a cracking game and if our activity can add a little more to the overall experience then it’ll be a great way to celebrate 50 years of the competition.”

Your be able to view the results via our customised Tweet-o-Meter over the weekend on Sky Sports and online, we will put a link up as soon as its ready.

In the meantime our city Tweet-o-Meter continues to 'mine' the cities for social trends...

2010-02-17

Please Rob Me.com - GeoTwitter Shows Empty Houses (To Rob).

We have been working on something behind the scenes recently that brings up all sort of issues of privacy, our worries pale into insignificance however compared to the twisted genius that is http://pleaserobme.com/


The site uses terms such as 'left home', compared to your profile to work out your not around, it then links to a map showing where your now empty home is (assuming you live on your own). Genius, as is the sites discaimer 'Our intention is not, and never has been, to have people burglarized.'

See http://pleaserobme.com/ for full details and a list of opportunities for those so inclined...

2010-02-10

Steam Punk Beta Tweet-O-Meter

As regular readers will know our Tweet-o-Meter features tweets per minute within a 30km area of New York, London, Paris, Munich, San Francisco, Barcelona, Oslo, Tokyo, Toronto, Rome, Moscow and Sydney.

Ben Blundell, here at CASA, has taken some time off from our TOTeM project and has hooked up a series of panel meters to the script via a custom arduino module. The result is a suitably 'steam punk' version of Tweets per minute in New York, London and Paris. We would of hooked up Munich but ran out of meters:

Analog Tweet-O-Meter from Benjamin Blundell on Vimeo.


All it needs now is a brass case and an 'on/off' handle...

Currently in beta and part of our wider 'Ask' tool it allows anyone to 'mine' data from Twitter or carry out a survey of either the world, a continent, a nation, a city or a local area. In short, we think it has notable potential for social science and the analysis of trends and relationships in a variety of areas.

We have run various beta tests on data collection with the main mining process starting next week over a 24 hour period. We aim to collect all tweets with a geo-location tag in the above cities, this is a large amount of data allowing various social, spatial and temporal analysis to be carried out.

The system is under development here at CASA as part of a wider survey tool as part of the NeISS project being coded by Steven Gray in association with Urban Tick, currently carrying out analysis on the data sampled so far.

See http://www.casa.ucl.ac.uk/tom/ to view the Tweet-o-Meter, we should have some early analysis soon and graphs for the cities within the next day or so.
For those too young or perhaps simply nostalgic for the late 70's/early 80's hit that inspired the work, here is PopMusik via YouTube (its great...).

Thanks go to Ben and Steven for their work on this - see Bens http://www.section9.co.uk/, and Stevens http://stevenjamesgray.com/ for more info on their work both inside and outside of CASA time. Thanks also go to Russ Garrett (russ.garrett.co.uk/) and the London Hackspace for help with the code.

2010-01-27

New York, London, Paris, Munich: Tweets Per Minute via our new Tweet-o-Meter

‘New York, London, Paris, Munich everybody talk about Pop Musik’ – that was 1979 and the catch line by the group M. As such we thought it would be interesting to mine what people are talking about in 2010.

We are planning to log all geolocated Tweets in NewYork, London, Paris and Munich over a 24 hour period via the Twitter API as part of research under the NeISS project in association with UrbanTick and ourselves here at Digital Urban, part of CASA, University College London.


The system is running in beta mode over the next week with visualisation of the Tweets per Minute provided via our Tweet-o-Meter. While the reference to the 1979 is all well and good the system is actually designed to mine data for later analysis relating to further our understanding of the social and temporal dynamics of cities within the Twitter demographic. These can be mapped allowing us to capture 24 hours in the life of the city.

Below is an example of the type of base output we expect, as we are also extracting the social data and retweets we can map this in both time and space. UrbanTick has a nice tutorial on how to the do the timelapse of Tweets below:

London Weekend on Twitter from urbanTick on Vimeo.

Currently in beta mode the Tweet-o-Meter updates every 10 seconds displaying the city with the highest number of Tweets, the logged 24 hour period will be announced next week. Once collected we will be able to create city maps detailing the Tweet activity over time and space, a wider ranging system will be launched as part of a free data collection service via NeISS in the next couple of months.


See http://www.casa.ucl.ac.uk/tom/ to view New York, London, Paris, Munich via Tweet-o-Meter and if your in one of those cities and want to take part, simply make sure you have geolocation turned on in your Twitter preferences.

For those too young or perhaps simply nostalgic for the late 70's/early 80's hit that inspired the work, here is PopMusik via YouTube (its great...).

2009-07-09

TwitARound: Augmented Reality Tweets in the City

TwittARound is an augmented reality Twitter viewer on the iPhone 3GS. It shows live tweets around your location on the horizon with the video see-through effect allowing you to see where the tweet comes from and how far it is away:


Download Squad, where we picked it up from, didn't seem to see the point, we think its an incredably intriguing view of the cityscape - to be able to pan around a area and see the live tweets is perhaps a glimpse into the 'X-Ray Datascape' city of the future?

See TwittARound for more info.

2009-05-19

Visible Tweets: Visualising Twitter via Animated Tag Clouds

Visible Tweets is a visualisation of Twitter messages designed for display in public spaces and its really rather nice. The movie below shows visible tweets of the terms 3d virtual city with a tag cloud animation:

Visible Tweets from digitalurban on Vimeo.


Head over to http://visibletweets.com/ to give it a go, be warned it can be addictive...

2008-07-25

Flickr/Twitter Vision 3D Earth View


Flickrvision - A Global View of Flickr Uploads from digitalurban on Vimeo.


The movie above illustrates Flickrvision, a near real-time update displaying geolocated images uploaded to the photo sharing site Flickr. Updates can be viewed via either Google Maps or in their new custom 3D Earth view.

We have it running on a screen in the office as its simply fascinating (some would say hypnotic) to sit back and watch images being uploaded according to location. Twittervision offers the same but with tweets replacing images, it is almost more compulsive viewing to see what people are twitting about around the globe.

View Flickrvision

View Twittervision

Flickrvision and Twittervision are coded by David Troy

2007-04-03

Twitter Live Maps with GeoRSS and Atlas

Twitter is a social network based on a simple web/phone sms/messenger text box asking simply 'what are you doing?' It is unique in terms of social networks as there are applications that allow 'Tweets' - that's Twitter for 'Posts' to be visualised geographically. As such it is no longer a social network existing in the ether such as MySpace, instead it is a unique realtime, global insight into what people are doing right now.

In previous posts we have looked at Twitter Maps and Twitter Vision, both interesting applications, allowing the geographic data posted with Twitter to be visualised. Yesterday we got a comment on the blog from Fresh Logic Studios, the developers of Atlas, about their new Twitter Visualisation:

Fresh Logics approach is to use GeoRSS and Atlas to load Twitter feeds every 5 seconds as an overlay to the mapping interface. This takes a step forward, compared to say TwitterVision, as it also provides a sidebar listing the latest Tweets.

To emphasise the geographic nature of the Twitter Network, if you select the 'Street View' option the interface zooms each Tweet to the local location. The above image is from a user in Vienna, complete with Tweet and location. The ability to view someones Tweet, image and location seconds after they have sent it is both fascinating and slightly worrying. Expect a lot of papers from Social Scientists in the near future. Come to think of it we have just included Twitter in a book chapter entitled The Visual City, coming soon...

We will have more on Atlas in future posts, of note is their similar application using Flickr.

Take a look at the Twitter Visualisation using Atlas (warning you could spend hours just watching it).

More about Fresh Logic Studios.

Join our Twitter network for Tweets from DigitalUrban and fellow readers..

2007-03-21

Twitter Maps - A Unique View of London

As we mentioned in a our previous posts on the real time visualisation of Twitters - Twitter is intriguing, part social network, part text message, part location aware it almost redefines communication in its purest sense. Limited to 140 characters and based around a simple text box - a text box, asking "What are you doing?" it is difficult to understand at first..

The realtime visualisation of Twitter is an interesting visualisation - but in terms of the city then Twitter Maps lets you get down to street level to view people posting their 'Tweets' (that's Twitter language for messages). The screengrab below is the Twitter Map zoomed into London and there are a surprising number of people Twittering this morning:


Twitters are simply about what people are doing - for example in the image above Redmedicine posted 'Finishing breakfast, mopping up a leaky cappuccino and staring down the barrel of another wonderful day. But the sky is blue!' Simple yet addictive and by linking it to a mapping interface it provides a unique visualisation about what people are doing in the city right now.

Twitter is tipped to be the next important social network on the web, indeed CNN Money state that 'the free service, which combines the instant voyeurism of personal blogs with the brevity of text messages, appears to be catching fire, doubling its user base every month. It had 10,000 users by December and expects to hit 100,000 by April. Users post pithy updates on their lives (in no more than 160 characters) via the website, their IM clients, or their mobile devices. These posts can be sent just to their circle of friends or, if the user allows it, they can be added to Twitter's public time line. (A free desktop widget called Twidget also features the updates.)

You can join our Twitter network and take part in the emerging Twitter phenomoenon. At the moment on our side bar to the right are our current Tweets, once we get a network in place we will be able to display other peoples Tweets, which would be an intriguing insight into the readers of Digital Urban.

We will be posting more applications for Twitter networks over the coming weeks.

2007-03-20

Visual City - The Dreaming Wall

I am writing a book chapter at the moment on the 'Visual City' and got thinking about our previous post on Urban Twitters and how the city could be used to visualise such communication. Turns out that by using a computer controlled UV laser projector and phosphorescent panels on a building wall it can, and indeed has been, done:


The Dreaming Wall, movie pictured above, is a project running in a historical square in Milan, conceived as a info-forum it randomly displays sms messages sent by standing in the square or via the Internet - similar in many ways to Twitter.

Take a look at the Dreaming Wall project which can be seen at the Galleria Contemporaneo, Mestre, Italy until March 31st.

2007-03-19

Urban Twitter(s)

Twitter is intriguing, part social network, part text message, part location aware it almost redefines communication in its purest sense. Limited to 140 characters and based around a simple text box - a text box, asking "What are you doing?" it is difficult to understand at first..

Take a look at Twittervision - Twitters visualised live on a Google Map:


It begins to make sense when you realise you can activate your phone and therefore send messages remotely to a bunch of people.. anyway while we think of the possibilities you can add digitalurban to your twitter network, and then twitter about anything urban with fellow twitters and readers.