CityDashBoard TalesofThings MapTube
Qrator Tutorials About Digital Urban
MRes ASAV SurveyMapper Contact Us
Showing posts with label New York. Show all posts

2011-02-05

New York: Pinball Skyline

The short below was developed by Lizzie Oxby, a multi-award winning director who graduated from the Royal College of Art in 1996 to remind her of the joy of the New York skyline, the clip is based around three photographs:

Manhattan 4.33pm from Lizzie Oxby on Vimeo.

Entitled 'Manhattan: 4.33pm' the movie has been selected as a finalist in Raindance's Welcome to the Extraordinary competition.

See lizzieoxby.com for more of her work.

2010-10-22

Visualising Space-Time Dynamics in Scaling Systems: Rank Clocks

Sometimes you have to take a step back and take a look around a science lab to appreciate the wealth of knowledge and research being carried out. Rank Clocks by Professor Mike Batty here at CASA, The Bartlett, University College London, is a prime example.

A rank clock is a device for visualising the changes over time in the ranked order of any set of objects where the ordering is usually from large to small. The size of cities, of firms, the distribution of incomes, and such-like social and economic phenomena display highly ordered distributions. If you rank order these phenomena by size from largest to smallest, the objects follow a power law over much of their size range, or at least follow a log normal distribution which is a power law in the upper tail.


Mike has examined the UK urban system from 1901 to 2001, the World System from 430BCE to 2000, and the Ancient World System from 3700BCE to 1000BCE. All these examples show quite regular stability in rank size at the aggregate Zipf Plot level but much greater volatility in terms of the Rank Clocks and this in an of itself throws grave doubt on the issue of universality and regularity in such systems. Moreover it opens up once again the paradox of why systems show such regularity at the macro level when everything is changing at the micro level.

We detail the rank clock illustrating how the rank of cities in the USA changed between 1790 and 2000 below:

Rank clock for US cities from Michael Batty on Vimeo.


In fact for cities and other phenomena such as the distribution of word frequencies, George Kingsley Zipf as long ago as the 1930s characterised such distributions as characterising pure power laws in which the size of an object seemed to approximate the largest object in the set divided by the rank of the object in question. Such strict power laws in fact seem to be the exception rather than the rule but many such rank size distributions seem to follow such laws in their upper tail, and hence these are taken as signs of system stability, self-organisation and universality.

Below we illustrate the animation of a rank clock of the top 100 high buildings in New York change between 1912 and 2008:

Rank clock of the top 100 high buildings in New York from Michael Batty on Vimeo.


However, despite the fact that such distributions are so regular even through time, when one examines how objects within these distributions change over time, it is quite clear that somehow these systems remain stable at the aggregate level but with objects which composes them shifting quite dramatically from time period to time period.

The Rank Clock Software can be downloaded from the CASA, the full paper can be found on Nature.
You can also download CASA Working Paper 152 Visualising Space-Time Dynamics in Scaling Systems. (pdf).

Thanks go to http://gisagents.blogspot.com/

2010-08-04

Invisible, Hidden, Parallel Cities: Twitter Landscapes

By revealing the social networks present within the urban environment, Invisible Cities describes a new kind of city—a city of the mind. The movie below by Christian Marc Schmidt displays geocoded activity from online services such as Twitter and Flickr, both in real-time and in aggregate. Real-time activity is represented as individual nodes that appear whenever a message or image is posted. Aggregate activity is reflected in the underlying terrain: over time, the landscape warps as data is accrued, creating hills and valleys representing areas with high and low densities of data.

In the piece, nodes are connected by narrative threads, based on themes emerging from the overlaid information. These pathways create dense meta-networks of meaning, blanketing the terrain and connecting disparate areas of the city:


Invisible Cities maps information from one realm—online social networks—to another: an immersive, three dimensional space. In doing so, the piece creates a parallel experience to the physical urban environment. The interplay between the aggregate and the real-time recreates the kind of dynamics present within the physical world, where the city is both a vessel for and a product of human activity. It is ultimately a parallel city of intersections, discovery, and memory, and a medium for experiencing the physical environment anew.

Our movie below of London's Tweets displays a similar 'hidden city':


As we posted a few weeks ago, we have been harvesting geospatial data from Twitter with the aim of creating a series of new city maps based on Twitter data. Via a radius of 30km around New York, London, Paris, Munich we have collated the number of Tweets and created our New City Landscape Maps. The maps created by UrbanTick detail the social networking landscaping.


Pictured above is London, below is New York:


UrbanTick has the full run down with New York, London, Paris and Munich, all available in glorious full screen mode via a Google Maps viewer - head over to take a look at the New City Landscapes.

Thanks got to Steven Gray who did the coding and Fabian over at Urban Tick for converting the data into maps. Also thanks to Dr Chris Speed who sent in the invisible cities movie link.

2010-02-26

Composite Cityscape: New York

Darren is a freelance designer/artist based in Belfast, Northern Ireland, his cityscape composite of New York below has been created as part of a showreel in his bid to gain some freelance visual effects work in the world of fantasy/sci-fi television:


Its nice to feature such projects sometimes rather than the high-end visualisations from established studios.

See Darren's site http://planetmirth.weebly.com/ for full details...

2010-02-12

City Tweet Meter: Adds Graphs, Dials, London ahead of New York

Our Tweet-o-Meter which keeps track of tweets per minute within a 30km area of New York, London, Paris, Munich, San Francisco, Barcelona, Oslo, Tokyo, Toronto, Rome, Moscow and Sydney, now features graphs. We are currently running dynamic graphs for each city over the last hour with 24 hour graphs online next week. The results are interesting, London is just ahead of with New York on number of tweets with Oslo, Rome and Sydney in the lower ranks.


Currently in beta, the meter is part of our wider 'Ask' tool which will allows anyone to 'mine' data from Twitter or carry out a survey of either the world, a continent, a nation, a city or a local area. In short, we think it has notable potential for social science and the analysis of trends and relationships in a variety of areas.

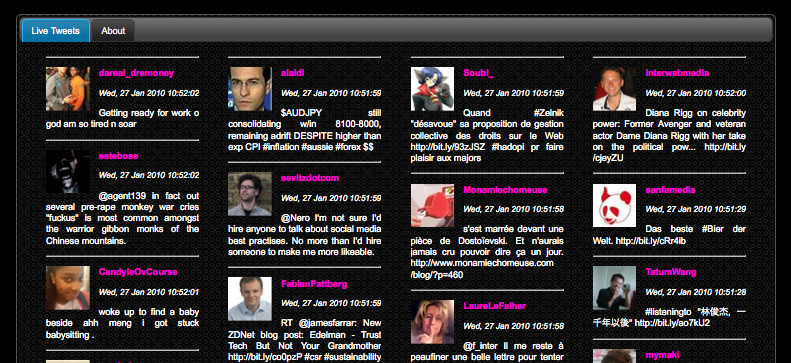
We have run various beta tests on data collection with the main mining process starting next week over a 24 hour period. We aim to collect all tweets with a geo-location tag in the above cities, this is a large amount of data allowing various social, spatial and temporal analysis to be carried out.

The system is under development here at CASA as part of a wider survey tool as part of the NeISS project being coded by Steven Gray in association with Urban Tick, currently carrying out analysis on the data sampled so far.

We are moving it into the 'real world' as well with a series of Tweet-o-Meters linked to panel meters sitting on our shelves here in CASA:

Analog Tweet-O-Meter from Benjamin Blundell on Vimeo.


Take a look for yourself - The City Tweet-o-Meter

2010-01-28

Tweet-o-Meter adds San Francisco, Barcelona, Tokyo and Oslo to its Data Mine: Urban Tweets per Minute

Due to various emails asking 'where is xxx' we have added four more cities to the Tweet-o-Meter which means more data to collect and analyse. Is it true that, New York is the city that never sleeps? Do Londoners send more Tweets than New Yorkians'? Is Oslo a bigger Tweeter than Munich? Is Tokyo into Tweets as much as Barcelona? Has San Francisco calmed down after that
Apple Event?


The Tweet-o-Meter measures the amount of tweets (measured in Tweets per Minute or TPM) received from various locations around the world. The gauges are updated every second giving you a live view of the TPM's in each location.

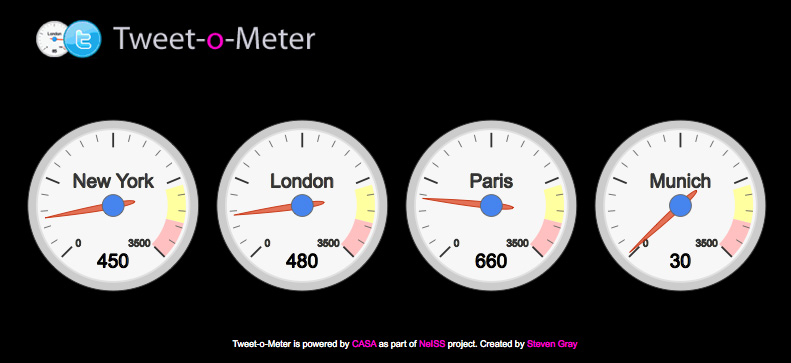
Tweet-o-Meter is designed to mine data for later analysis relating to furthering our understanding of social and temporal dynamics for e-Social Science within the Twitter demographic. The system is under development here at CASA as part of a wider survey tool as part of the NeISS project in association with Urban Tick and coded by Steven Gray.

See yesterdays introduction to Tweet-o-Meter post for full details and the music video behind the original choice of cities or head direct to the Eight Cities Head-to Head Tweet-o-Meter Page.

2010-01-27

New York, London, Paris, Munich: Tweets Per Minute via our new Tweet-o-Meter

‘New York, London, Paris, Munich everybody talk about Pop Musik’ – that was 1979 and the catch line by the group M. As such we thought it would be interesting to mine what people are talking about in 2010.

We are planning to log all geolocated Tweets in NewYork, London, Paris and Munich over a 24 hour period via the Twitter API as part of research under the NeISS project in association with UrbanTick and ourselves here at Digital Urban, part of CASA, University College London.


The system is running in beta mode over the next week with visualisation of the Tweets per Minute provided via our Tweet-o-Meter. While the reference to the 1979 is all well and good the system is actually designed to mine data for later analysis relating to further our understanding of the social and temporal dynamics of cities within the Twitter demographic. These can be mapped allowing us to capture 24 hours in the life of the city.

Below is an example of the type of base output we expect, as we are also extracting the social data and retweets we can map this in both time and space. UrbanTick has a nice tutorial on how to the do the timelapse of Tweets below:

London Weekend on Twitter from urbanTick on Vimeo.

Currently in beta mode the Tweet-o-Meter updates every 10 seconds displaying the city with the highest number of Tweets, the logged 24 hour period will be announced next week. Once collected we will be able to create city maps detailing the Tweet activity over time and space, a wider ranging system will be launched as part of a free data collection service via NeISS in the next couple of months.


See http://www.casa.ucl.ac.uk/tom/ to view New York, London, Paris, Munich via Tweet-o-Meter and if your in one of those cities and want to take part, simply make sure you have geolocation turned on in your Twitter preferences.

For those too young or perhaps simply nostalgic for the late 70's/early 80's hit that inspired the work, here is PopMusik via YouTube (its great...).

2009-04-15

New York City 2259


Procedural with their impressive cityengine is certainly a company to watch, we have had a chance to use their demo and the ability to import GIS layers, combined with the rapid creation of cities is certainly impressive. As such their work on New York City 2259 is well worth a look.

NYC 2259 by is the extrapolation of New York city 250 years into the future, inspired by the great 1998 motion picture The Fifth Element.

Today's street network of NY, imported from openstreetmap.org, has been extended to a bigger area, available due to the lower water levels in the future.
The example includes grammar rules to create futuristic skyscrapers in two levels of detail as well as flying cars - press play below:


Take a look at the NYC 2259 page for full details...

2009-04-06

YouCity.com Launch 3D New York Map


A while ago we posted about ShangHai WangCheng Net Tech Co., Ltd and their maps of cities in China created in a unique 'sim city esk' point of view. The company has partnered with YouCity.com to explore the western market and have just announced the launch of their next generation 'hyper local social network website' based on a unique 3D virtual New York City platform at the 2009 Web 2.0 Expo.

The results are impressive, see our movie below:


Take a look by visiting http://www.youcity.com.

2008-07-29

YouCity New York: Stunning 3D Map of Manhattan


You City: Sample Map of Manhattan from digitalurban on Vimeo.

A while ago we posted about ShangHai WangCheng Net Tech Co., Ltd and their maps of cities in China created in a unique 'sim city esk' point of view. The company has partnered with YouCity.com to explore the western market and have just released 3 demos maps of Manhattan.

The results are stunning (see the movie above) with the final version offering multi-angle viewing and an open api promised.


You can take the samples for a spin yourself by visiting http://www.youcity.com. Such maps certainly raise the bar on what will become the norm in city mapping over the next few years.