CityDashBoard TalesofThings MapTube
Qrator Tutorials About Digital Urban
MRes ASAV SurveyMapper Contact Us
Showing posts with label Data Visualisation. Show all posts

2012-06-26

3D Visualisation of World Flight Paths

Robin Edwards, a student on our MRes in Advanced Spatial Analysis and Visualisation here at the Centre for Advanced Spatial Analysis, University College London, has used Processing to create a visualisation using data from OpenFlights.org. The clip below visualises approx 50,000 active flight-paths,interpolating motion along great circle paths for dynamic effect:


Robin notes that it does not account for multiple airlines or scheduled flights, but the path data still seems a reasonable proxy for flight visualisation.

For more head over to http://geotheory.org/ 

We like it so much it is slide one in our lecture on Geography in a Web 3.0 World at the Research Methods Festival 2012 at Oxford University next week...

2012-06-06

6 Fellowships £10,000 Each at The Centre for Spatial Analysis and Policy (CSAP) in Leeds or the Centre for Advanced Spatial Analysis (CASA) in London

We are pleased to announce the availability of six fellowships are available to support individuals in non-academic institutions to undertake defined research projects at the Centre for Spatial Analysis and Policy (CSAP) in Leeds or the Centre for Advanced Spatial Analysis (CASA) in London. The Fellowships will provide individuals with an opportunity to learn and apply spatial analytical methods to their own data.
Value
Fellowships are valued at up to £10,000 each and will cover costs for up to 3 months for full-time projects and 6 months for part-time work (although other temporal arrangements may be considered).
 Eligibility
To qualify to apply for a fellowship individuals should:
  • - Belong to a non-academic organisation
  • - Have a degree (preferably in geography)
  • - Have the support of their organisation
  • - Be located in the UK.
Application Procedure
To apply for a fellowship, please include the following by email under single cover and preferably as one PDF file:
  • - A completed User Fellowship application form
  • - A letter of support from your employer
Applications should be sent to Amy O’Neill, TALISMAN Project Assistant: a.oneill@leeds.ac.uk
 Deadline
We require all materials to be sent together by 4pm on September 21, 2012.
Enquiries
If you would like further information about the fellowships or to discuss a potential project before applying, please contact:
At CSAP:
Mark Birkin, email: m.h.birkin@leeds.ac.uk
John Stillwell, email: j.c.h.stillwell@leeds.ac.uk
AT CASA:
Andy Hudson-Smith, email: a.hudson-smith@ucl.ac.uk

TALISMAN is a node of the National Centre for Research Methods (NCRM) and is funded through the Economic and Social Research Council (ESRC) as part of a strategy to improve the standard of research methods across the UK social science community.  The key rationale for TALISMAN is to act as a catalyst for methodological innovation by forging strong links between research and capacity building in geospatial analysis and simulation. TALISMAN is based at the University of Leeds and the University College London.

2011-03-22

Public Transport Flows in London: A CASA Movie

Sometimes in a research lab you step back in awe at some of the research going on around you. The work from the team behind the new Simulacra blog from CASA is one of those moments, visualising the dynamic geography of the urban transport system:

Public Transport flows, London from Joan Serras on Vimeo.

The movie above details the public transport flows of London, it is interesting to note the bus network transition from night to day, the steady ‘pulse’ of the tube network throughout its service and the Stansted-Heathrow-Gatwick connection defined by the coach network.

Take a look at http://simulacra.blogs.casa.ucl.ac.uk/ for full details, including an amazing country wide version.

2010-09-20

WikiLeaks Map: How Leaky is Your Country

WikiLeaks is a multi-jurisdictional public service designed to protect whistleblowers, journalists and activists who have sensitive materials to communicate to the public. Since July 2007, they have worked across the globe to obtain, publish and defend such materials, and, also, to fight in the legal and political spheres for the broader principles on which our work is based: the integrity of our common historical record and the rights of all peoples to create new history.

The question is which countries have the most leaks, what you need to 'How Leaky is your Country' by Ben Blundell here at CASA, University College London.


Written in HTML 5 the site trawls WikiLeaks daily and maps the outputs, it is well worth a look. Go to http://www.section9.co.uk/wikileaks for full info (it works best in Chrome).

A deeper analysis is forthcoming along with various new features, this is purely a first stage but an interesting one....

2010-06-11

MRes Advanced Spatial Analysis and Visualisation: Curriculum, Aims and Admission

Below we provide full details for 2010 entry on the new MRes in Advanced Spatial Analysis and Visualisation (ASAV). The course reflects the current state of play in geographic, urban and architectural information systems with an emphasis on visualisation, analysis and modelling. Taught at the Centre for Advanced Spatial Analysis, home of digital urban, it is an innovative and exciting opputunity to study at UCL with a MRes acting as a pathway to a PhD or further career in ASAV.

Course Executive Summary

The Centre for Advanced Spatial Analysis (CASA) is an initiative within University College London to develop research in emerging computer technologies in several disciplines dealing with geography, space, location, and the built environment. As an interdisciplinary research centre expertise is drawn from archaeology, architecture, cartography, computer science, environmental science, geography, planning, remote sensing, geomatic engineering, and transport studies. The Centre is located within The Bartlett at UCL, from which it is administered but it has associated students and faculty in other faculties, specifically in Geography and in Civil (Geomatic) Engineering. This structure generates a unique blend of knowledge forming the core of the MRes ASAV.


The MRes is unique in its focus on complexity, modelling, mapping and visualisation, pulling together the latest research in urban form, functionality and communication. Recent changes in the rise of web-based technologies and the development of low cost yet complex visualisation and analysis packages has generated a notable change in the demand for more traditional vendor specific information systems and computer aided design courses.


The MRes ASAV reflects this change with a look towards Web 3.0 (Read, Write, Execute) technologies and methods to deliver skills required for current/future professionals and policy makers engaged in spatially related projects.


Curriculum Structure


The course has a strong research component based around developing new methodologies from new task specific software and techniques that have emerged as part of what may be termed the ‘Web Revolution’. CASA has been at the forefront of these changes that have impacted the way we share, communicate and distribute information, specifically information relating directly to geographic and spatial entities. These changes have steadily emerged since the mid 1990’s and it is now quite clear that location and space now represent a third force in information technology besides more traditional computer and communication science.

We reflect these changes within the interlinked laboratory-research-based mini project with data collection focused on ‘remote data mining’ rather than fieldwork in the traditional planning/geographical/architectural sense. Indeed these research led skills are increasingly becoming a key element in shaping our understanding of complex spatial functions.


Vast amounts of previously unused data are becoming available either from changes in accessibility, due to the nature of the network and cloud based computing, changing national data policies or more widely as a result of new mass data collection methodologies.


Course Aims

The programme aims to provide training in the principles and skills of social and spatial research. Its aims include a strong understanding of qualitative and quantitative research methodology and methods of data collection and analysis to support and enable independent and group research projects. In addition to focusing on research skills, subject specific modules provide students with the opportunity to develop an excellence in spatial analysis with the specific skill set to engage and contribute to the current debates in urban and spatial continuums.

Course Delivery

The course runs full-time over 12 months. The taught element of the course is delivered on two days per week over the first two terms.

Modules

BENVGSA1 - Group Mini Project: Digital Visualisation
The module introduces the students to methods of visualisation and data mining within the geospatial domain. Developed as a group project the module aims to provide an understanding of the juxtaposition between research, data capture and data display methodologies. As such the module is developed to build upon the taught sections of the course (BENVGSA3 and BENVGSA4) to develop initial research questions for the dissertation (BENVGSA2). Project assessment will be on a group basis.
Credits: 30
Terms: 1 and 2


BENVGSA2 - Advanced Spatial Analysis and Visualisation MRes Dissertation
The module is based around the writing, preparation of an original research project in the form of a Masters Dissertation. Students will be required to plan the research and dissertation from an early stage with ongoing development building on both the mini-project and taught courses developed through the year. The research topic will be defined under the guidance of the students dissertation supervisor with the support of the Course Director. The aim is to produce a unique, individual piece of work with an emphasis on data collection, analysis and visualisation linked to policy and social science orientated applications.
Credits: 90
Terms: 1, 3, 4

BENVGSA3 - GI Systems and Science
The aim of this module is to equip students with an understanding of the principles underlying the conception, representation/measurement and analysis of spatial phenomena. As such, it presents an overview of the core organising concepts and techniques of Geographic Information Systems, and the software and analysis systems that are integral to their effective deployment in advanced spatial analysis.
Credits: 15
Term: 1

BENVGSA4 - Spatial Modelling and Simulation
This course will introduce students to the theory, principles and applications of mathematical and computer modeling as applied to cities. It will be based on five interrelated themes: an introduction to definitions of models as they relate to the philosophy of science; the model-building process involving calibration and prediction; types of urban models ranging from land use transportation models, microsimulation, discrete choice, cellular automata and agent-based models; the exploration of two specific types of model, namely land use transportation; and then cellular automata ABM.
Credits: 15
Term: 2

EDUCGE01 - Investigating Research
EDUCGE02 - Professional Development in Practice


ADMISSIONS

For details of how to apply, please see http://www.ucl.ac.uk/prospective-students/graduate-study/application-admission If you decide to apply, you will need to submit an application form, two references (either two academic references or one academic reference and one work reference), transcript(s) of your degree(s) (must be officially translated if applicable). Please note that all application forms and supporting documents need to submitted directly to the College Admissions Office (address on application form).

Informal enquiries should be directed to the course director, Dr Andrew Hudson-SmithThere are no application deadlines for any Bartlett programmes but we do advise applicants to apply sooner rather than later, as once offers of admission are issued for all the vacancies available, it is no longer possible to issue any further offers of admission to applications which are received subsequently. We would advise that you seek to submit an application no later than June 2011 if you wish to be considered for the 2011/12 academic session.


2010-04-29

Crowd Sourced Data: The Copenhagen Wheel for Pollution, Congestion and Road Conditions in Real-Time

This is one of the best projects we have seen in sometime, borderline genius - the Copenhagen Wheel. The project transforms ordinary bicycles quickly into hybrid e-bikes that also function as mobile sensing units. The Copenhagen Wheel allows you to capture the energy dissipated while cycling and braking and save it for when you need a bit of a boost. It also maps pollution levels, traffic congestion, and road conditions in real-time.


Controlled through your smart phone, the Copenhagen Wheel becomes a natural extension of your everyday life. You can use your phone to unlock and lock your bike, change gears and select how much the motor assists you. As you cycle, the wheels sensing unit is also capturing your effort level and information about your surroundings, including road conditions, carbon monoxide, NOx, noise, ambient temperature and relative humidity.

Access this data through your phone or the web and use it to plan healthier bike routes, to achieve your exercise goals or to meet up with friends on the go. You can also share your data with friends, or with your city - anonymously if you wish thereby contributing to a fine-grained database of environmental information from which we can all benefit.

2010-04-27

Airspace Rebooted Movie

We are always suckers for data visualisation clips and this one of the northern European airspace returning to use after being closed due to volcanic ash is great. Due to varying ash density across Europe, the first flights can be seen in some areas on the 18th and by the 20th everywhere is open:


The flight data is courtesy of flightradar24.com and covers a large fraction of Europe. There are a few gaps (most noticeably France) and no coverage over the Atlantic, but the picture is still clear.

The map data is CC-by-SA openstreetmap.org and contributors.

This CC-by-SA visualisation was produced by itoworld.com with support from ideasintransit.org

2010-04-09

Data is the New Business Battleground

Well according to Greenplum it is and to be honest, we agree - data is everything. Of course it has to be quality data, backed up by suitable analysis, preferably spatial, the movie below makes a good point:


Your Data Rules the World - trailer from Greenplum Software on Vimeo.

If data is the new battleground then you would be wise to sign up for a MRes in Advanced Spatial Analysis and Visualisation (ASAV) at University College London, we will have more news on our recently approved course as soon as we can blog about it. Although, if your looking for a Masters course starting September you might want to wait for details before you sign up elsewhere...

2010-03-26

A Photoshop for Graphs - Introducing Gephi

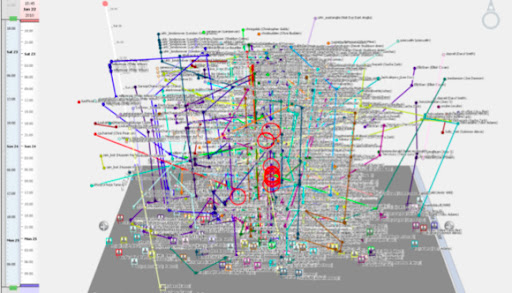
The last 12 months have seen the release of vast amounts of publicly available data, which has led to a bit of conundrum on how to easily visualise complex networks. What is needed is a 'Photoshop for Graphs' which is exactly what Gephi is. In short, Gephi is an interactive visualization and exploration platform for all kinds of networks and complex systems, dynamic and hierarchical graphs - the movie is great:

Introducing Gephi 0.7 from gephi on Vimeo.

Gephi runs on Windows, Linux and Mac OS X. Gephi is open-source and free, whats not to like...

2010-02-01

Data Mining and Tweet-o-Meter now with Moscow, Rome, Toronto and Sydney

Our data mining tool Tweet-o-Meter now features tweet per minute within a 30km area of New York, London, Paris, Munich, San Francisco, Barcelona, Oslo, Tokyo, Toronto, Rome, Moscow and Sydney. Currently in beta and part of our wider 'Ask' tool it allows anyone to 'mine' data from Twitter or carry out a survey of either the world, a continent, a nation, a city or a local area. In short, we think it has notable potential for social science and the analysis of trends and relationships in a variety of areas.

We have run various beta tests on data collection with the main mining process starting next week over a 24 hour period. We aim to collect all tweets with a geo-location tag in the above cities, this is a large amount of data allowing various social, spatial and temporal analysis to be carried out.

The system is under development here at CASA as part of a wider survey tool as part of the NeISS project being coded by Steven Gray in association with Urban Tick, urban tick is currently carrying out analysis on the data sampled so far:


2009-09-11

Data Visualisation: Budgets and Good Morning Twitter

If like us you are often trying to find interesting new ways to visualise data then a quick look at the collection on Vimeo can lead to many lost hours.

One excellent example is of British Columbia's budget update by blprnt:

BC Budget Visualization Tool from blprnt on Vimeo.


blpnt seems to have quite a talent for visualisation, below is his work regarding people saying good morning on twitter:

GoodMorning! First Render from blprnt on Vimeo.


The movie details approximately 11,000 tweets collected over a 24 hour period between August 20th and 21st. The tweets were harvested to find people saying 'good morning' in English as well as several other languages. It was built in Processing (processing.org) using Twitter4J, and a home-brewed client for MetaCarta's geo-parsing APIs.

It is well worth a visit to the blog - blog.blprnt.com, excellent stuff...

2009-08-13

The Brooklyn Typology Project: Urban Omnibus

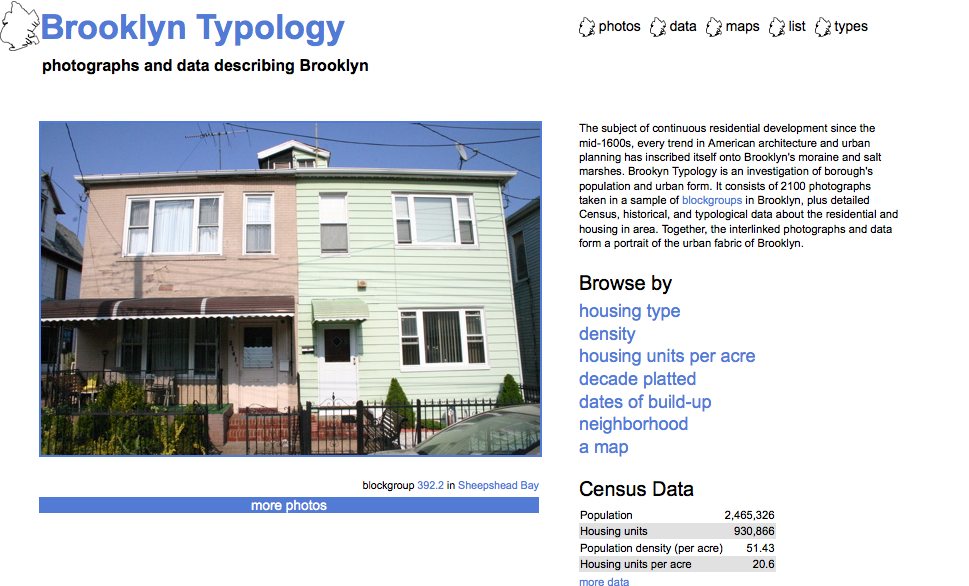
The Urban Omnibus is an online creation of the Architectural League to create a new kind of conversation about design and New York City. A fascinating website in itself they have also just posted a great write up of the The Brooklyn Typology Project.


The Brooklyn Typology Project provides photographs and data describing Brooklyn, you can browse by housing type, density, housing units per acre, decade, date of build, neighborhood or simply by location. We have just spent a good half hour rummaging around the site and especially like the 'industrial' section under housing type, its a neat way to explore residential density.

You can read the full write up on Urban Omnibus...

2009-06-07

Data Visualisation and Communication: Architecture & Landscape

Architecture & Landscape from ecosistemaurbano on Vimeo.


This is a nice visualisation of data and the concept of space - we especially like the communication of the amount of living space per city towards the end of the clip.

The movie was produced by ecosistemaurbano his other movies include society and culture and a look at the worlds resources in the same style.

2009-05-19

Visible Tweets: Visualising Twitter via Animated Tag Clouds

Visible Tweets is a visualisation of Twitter messages designed for display in public spaces and its really rather nice. The movie below shows visible tweets of the terms 3d virtual city with a tag cloud animation:

Visible Tweets from digitalurban on Vimeo.


Head over to http://visibletweets.com/ to give it a go, be warned it can be addictive...

2009-05-18

Web Stats as a Populated CityScape: VisitorVille

VistorVille is a city based visualisation program for your webstats, each building represents a web page; each bus a search engine; and each animated character a visitor to the site:


Setup is as easy as pasting in a tracking code, we would try it out but the combination of cities and stats is probably a step too far if we want to get any work done this week...

Take a look at http://www.visitorville.com/ for a free trial and more info.

2009-05-05

Visualising City Wide Data: London Retail and Office Space


The movie below is a visualisation of office and retail space in London. Using data kindly supplied by the Economics Unit at the Greater London Authority, Duncan Smith a PhD student here at CASA has calculated the amount of retail and office in London per 500 metre grid square:


Duncan carried out the analysis in ESRI's ArcScene as part of his PhD. Intriguingly it is possible to export from ArcScene into Autodesk's 3D Studio Max allowing a much higher level of visual fidelity. Of course once it is in max you can then export to a number of other platforms, such as Unity as our previous post explained using the same data.

Here at CASA we have just completed the initial phase of our London database, as such we will be exploring more ways to visualise city based datasets in forthcoming posts.

2009-04-01

Data City: Pixel Art Visualisation


Data from Carine Bigot on Vimeo.


We do not have much information on this one, apart from it was uploaded to Vimeo by Carine Bigot. It is however very nicely done and deserves much more than the 32 views it currently has after 2 months online so if you have time do give it a click...

2008-12-18

Visualising Geographic Data - Population by Lights


Visualising geographic information above and beyond the normal export from your favorite GIS package is often left as a mere after thought. We are just starting to look into using Adobe After Effects to liven up a slightly dry dataset - UK Population represented as a point per 200 people.

Its early days and we were unsure to publish this one or not but that's what a blog is all about so below is our first go at After Effects using lights to get across a picture of Britain's population:


Visualising Data: UK Population One Light per 200 People from digitalurban on Vimeo.


Add in some camera tracking, smooth out the moment, provide some labels beyond the standard iMovie fare and we might be onto something... (?) - The movie is best viewed fullscreen.

The slightly misjudged music is by a rather good unsigned band - Lemonade Joe.

2008-08-12

Air Pollution in the City Visualisation: Nitrogen Dioxide, London


Air Pollution Visualisation: Nitrogen Dioxide, London from digitalurban on Vimeo.


Nitrogen dioxide (NO2): NO2 is produced in high temperature combustion processes and chemical reactions in the atmosphere. Road transport is responsible for 60 per cent of emissions of NOx (the pollutant that causes NO2) in London. It can affect the lungs and airways when exposed over long periods or at high concentrations over a short period.

The movie about depicts our visualisation at CASA of N02 in London, created in association with the Environmental Research Group at Kings College London. The movie was created to illustrate the use of the Virtual London model to gain a sense of location and place when communicating geo-specific information.

Moving data into the third dimension can however be counter productive. While the movie clearly communicates areas of high N02 concentration it also falsely suggests to some that the air is clear above the peaks - which is course it is not as N02 is measured from a set height. Although in general we would argue that it is more successful than the standard 2D map in getting the spatial information across...(?)

Click 'HD' in the movie to view in high definition via Vimeo.

2008-07-20

Shrinking Cities


Moving Datas from 1kilo on Vimeo.


The movie above comes from shrinkingcities.com - they state that '
Shrinking cities are a cultural challenge to us. In the Shrinking Cities project, architects, academics and artists investigate recent developments in Detroit, Ivanovo, Manchester / Liverpool and Halle / Leipzig - and make suggestions'.

Their world map is interesting:


World Map of Shrinking Cities from 1kilo on Vimeo.


With the recent move, a least in the UK, to brownfield site urban flats and apartment developments we would argue that perhaps British cities are growing in population rather than shrinking (?).

Shrinking cities is a project (2002-2008) of the Federal Cultural Foundation, under the direction of Philipp Oswalt (Berlin) in co-operation with the Leipzig Gallery of Contemporary Art, the Bauhaus Dessau Foundation and the magazine archplus.


For more information see shrinkingcities.com.