Over the last few weeks we have been looking at ESRI's CityEngine and how it can be used to create rapid urban scenes. As we noted it moves GIS visualisation a step forward while at the same time bringing procedural city modelling into the mainstream game engine world. Of course the heart of the CityEngine is the ability to import real world data but to get to grips with the interface it is sometimes easier to look at creating urban scenes from simple procedural rules.
As part of the MRes in Advanced in Spatial Analysis and Visualisation, here in CASA we have been looking at various techniques to visualise urban data. One such technique is the creation of a 3D exhibition space, allowing agent based models and urban data to be visualised within an architectural space.
The movie above combines the use of CityEngine in Lumion with SketchUp and 3DMax to insert an exhibition space into a city while burning the CASA logo into the street network. CityEngine is a notable step forward for ESRI, both in terms of visualisation and analysis, linking it with Lumion and SketchUp allows it to be taken even further, towards the ultimate city creation toolkit...
As regular readers will know our Tweet-o-Meter features tweets per minute within a 30km area of New York, London, Paris, Munich, San Francisco, Barcelona, Oslo, Tokyo, Toronto, Rome, Moscow and Sydney.
Ben Blundell, here at CASA, has taken some time off from our TOTeM project and has hooked up a series of panel meters to the script via a custom arduino module. The result is a suitably 'steam punk' version of Tweets per minute in New York, London and Paris. We would of hooked up Munich but ran out of meters:
All it needs now is a brass case and an 'on/off' handle...
Currently in beta and part of our wider 'Ask' tool it allows anyone to 'mine' data from Twitter or carry out a survey of either the world, a continent, a nation, a city or a local area. In short, we think it has notable potential for social science and the analysis of trends and relationships in a variety of areas.
We have run various beta tests on data collection with the main mining process starting next week over a 24 hour period. We aim to collect all tweets with a geo-location tag in the above cities, this is a large amount of data allowing various social, spatial and temporal analysis to be carried out.
The system is under development here at CASAas part of a wider survey tool as part of the NeISS project being coded by Steven Gray in association with Urban Tick, currently carrying out analysis on the data sampled so far.
See http://www.casa.ucl.ac.uk/tom/ to view the Tweet-o-Meter, we should have some early analysis soon and graphs for the cities within the next day or so. For those too young or perhaps simply nostalgic for the late 70's/early 80's hit that inspired the work, here is PopMusik via YouTube (its great...).
Thanks go to Ben and Steven for their work on this - see Bens http://www.section9.co.uk/, and Stevens http://stevenjamesgray.com/ for more info on their work both inside and outside of CASA time. Thanks also go to Russ Garrett (russ.garrett.co.uk/) and the London Hackspace for help with the code.
The Urban Omnibus is an online creation of the Architectural League to create a new kind of conversation about design and New York City. A fascinating website in itself they have also just posted a great write up of the The Brooklyn Typology Project.
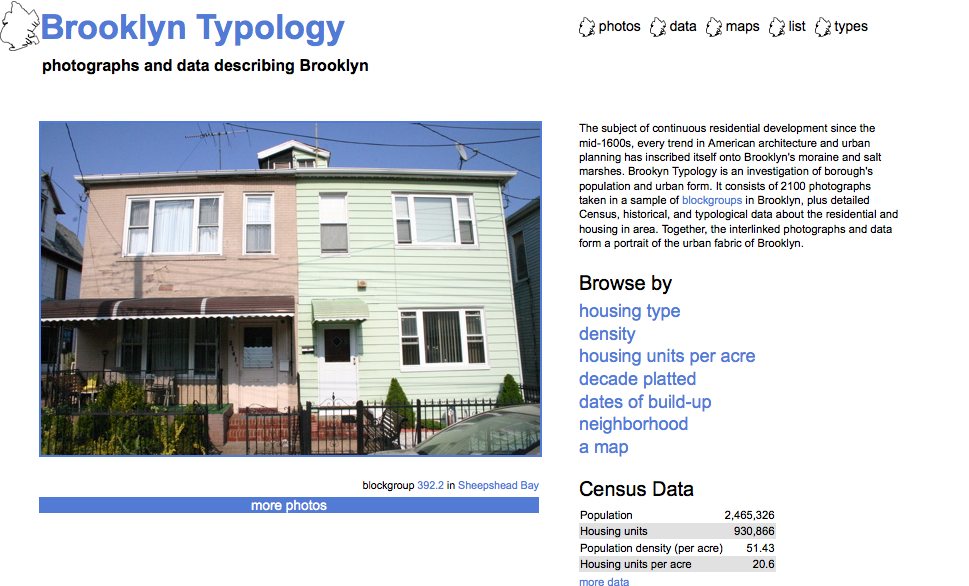
The Brooklyn Typology Project provides photographs and data describing Brooklyn, you can browse by housing type, density, housing units per acre, decade, date of build, neighborhood or simply by location. We have just spent a good half hour rummaging around the site and especially like the 'industrial' section under housing type, its a neat way to explore residential density.