BBC Look East is calling for people in the East of England to find out their home broadband speed, as part of the TV programme's week-long special - using our free SurveyMapper tool, at CASA, University College London, to collate and map the results in real time. So far over 6500 responses have been received.
It is estimated only 60% of households in the region have access to high speed broadband.
Look East's business reporter Richard Bond said that the figure was unlikely to grow much in the next five years.
Home broadband users can take part by plotting their speed onto an interactive map.
The results of the research will then be shown on BBC One during Look East's broadband week, which runs from 21 to 25 February 2011.
"Fibre optic networks, the key to a fast service, are only available to people in and around the major towns and cities," said Mr Bond.
"Broadband speeds in rural areas are slow because they depend on copper telephone exchanges.
"Although BT is rolling out its fibre optic network, this is unlikely to make much of a difference to most rural communities over the next five years," he added.
As broadband speeds on the same connection can fluctuate, it is recommended that people take the test several times and make a note of the highest speed.
Other speed-testing websites could return different results, so it is recommended for this research that third-party sites are avoided.
Once a figure is obtained, people can then plot their results on the BBC Look East map hosted on our SurveyMapper.
It is nice to see maps and indeed crowd sourced surveys used in such a way, SurveyMapper has been developed as part of NeISS (National e-Infrastructure for Social Simulation, funded by JISC as part of its Information Environment Programme.
You can set up your own survey or poll on SurveyMapper - If you have used other ‘polling sites’ then you will be up to speed, except we have taken away the restrictions and added real-time mapping into the mix. Simply sign up (its free) and then your be able to create your own survey and embed it into your own site. Currently we have five levels of survey available - Worldwide, based on countries, European Countries US Zip Code, UK Postcode and a Drag and Drop Pin Map.
You can ask anything, survey the nation, the world or just your street with real-time mapping and statistics.
To take part or create your own survey head over to SurveyMapper.com
The Look East survey runs until February 25th with updates each evening on BBC Look East News.
This is one of the best projects we have seen in sometime, borderline genius - the Copenhagen Wheel. The project transforms ordinary bicycles quickly into hybrid e-bikes that also function as mobile sensing units. The Copenhagen Wheel allows you to capture the energy dissipated while cycling and braking and save it for when you need a bit of a boost. It also maps pollution levels, traffic congestion, and road conditions in real-time.
Controlled through your smart phone, the Copenhagen Wheel becomes a natural extension of your everyday life. You can use your phone to unlock and lock your bike, change gears and select how much the motor assists you. As you cycle, the wheels sensing unit is also capturing your effort level and information about your surroundings, including road conditions, carbon monoxide, NOx, noise, ambient temperature and relative humidity.
Access this data through your phone or the web and use it to plan healthier bike routes, to achieve your exercise goals or to meet up with friends on the go. You can also share your data with friends, or with your city - anonymously if you wish thereby contributing to a fine-grained database of environmental information from which we can all benefit.
Google has just announced 'Google Buzz' a social networking tool similar in some ways to Twitter but with location brought to the forefront. You can quickly add your location to your 'buzz' and its viewable on a map. Of note is the 'buzz layer' in the new Google Maps app that allows you to see whats going on in a location via the local information provided by the users using buzz - the InfoCrowd:
Interesting and big enough to cause an upset in the current social networking scene, also powerful enough to change the way we view information about the city.
Visit buzz.google.com from your phone's mobile browser to start using buzz.
Below is a short paper we will be presenting in March at GISRUK 2009.
Crooks, A. T., Hudson-Smith, A., M., Milton, R., and Batty, M. (2009), Crowdsourcing Spatial Surveys and Mapping, in Fairbairn, D. (ed.), Proceedings of the 17th Geographical Information Systems Research UK Conference, Durham University, England.
This paper presents the potential of linking the GMap Creator software and the MapTube web service to create near-real time spatial surveys. Three different surveys will be presented which map people’s perceptions about certain questions, including the current financial crisis, anti-social behaviour and peoples thoughts on road pricing. Basic results will be highlighted for each and the geodemographic profiles of respondents will be explored. However, before discussing this, the underlying technologies that we use for the creation of the surveys: GMap Creator and MapTube, will be introduced.
1.1. GMap Creator
GMap Creator is a free piece of software that takes a shapefile and enables the creation of thematic layers which can be quickly and easily integrated into Google Maps in a simple ‘point and click’ manner (see Hudson-Smith et al. (under review) for more details). Using GMap Creator, it is possible to overlay pre-rendered thematic tiles on top of street and satellite views of Google Maps, making it possible to show complex areal coverage’s. The purpose of such a tool is to build feature rich cartographic websites that may easily be used and interpreted by individuals who have limited experience of spatial data handling (e.g. www.londonprofiler.org Gibin et al., 2008) rather than for more formal exploratory spatial data analysis.
1.2. MapTube
MapTube (www.maptube.org) combines the generic idea of YouTube where users can share information with the ability of GMap Creator to create thematic maps. MapTube provides a ‘place to put maps’ as we demonstrate in Figure 1, which highlights the most viewed maps currently on the MapTube site. MapTube acts as a portal for geographic data, data is not stored on the site. Every map hosted on MapTube is held on an outside server, and pulled in using the XML file which is automatically created when using GMap Creator. This allows data creators to maintain ownership of the data. MapTube allows one to view and compare different datasets as a series of layers (i.e. mashup) through the Google Map interface. However, we are currently working on an implementation for OpenLayers (see Milton, 2008).
Figure 1.MapTube home page showing the most popular maps.
2: Near Real-Time Spatial Surveys
Not only does MapTube allow people to share and view other people’s maps but it can also be used in more innovative ways. For example, as web surveys are often aspatial (e.g. surveymonkey.com), the ability to combine GMap Creator and MapTube offers a simple solution to build spatial surveys for large areas. Figure 2 shows the process of creating the near real-time maps. Users are asked a series of questions and to enter their postcode so that the results can be geo-coded. This is then sent to a web server, time stamped and stored in a database. Every 30 minutes (however, this can be varied) a script is run to create a new shapefile, compiling all the results from a survey, aggregating them into a spatial units (in this case postcode districts). The shapefile is then passed to GMap Creator along with an XML file containing information including: settings for colour thresholds, maximum level of zoom and the field name of the shapefile for which the map is to be created on. GMap Creator runs creates a series of image tiles which updates the map on MapTube which can then be served back over the internet.
Figure 2. The process of gathering, storing and creation of maps.
What follows are three surveys which map people’s perceptions about certain issues done in association various BBC organisations. For each survey no personal information was collected and participants were reassured that actual locations could not be identified. This was ensured through the use of postcode districts rather than the postcode unit or building address therefore preserving data confidentiality. Used in conjunction with MapTube, it allowed participants and other users to take other information and lay the maps on top of one other.
2.1. Mapping the Credit Crunch
A pilot study was carried out as an experiment to create a mood map of the credit crunch within the United Kingdom in conjunction with BBC Radio 4 iPM show . Based on what is the “singly most significant factor hurting the person the most about the credit crunch”, participants were asked to enter the first part of their postcode (postcode district) so their responses could be geo-tagged along with one of six options to choose from: mortgage or rent, fuel, food prices, holidays, other, or the credit crunch is not affecting me.
Between 26th April and 29th June 2008 there were 23475 responses to the survey with 48.8% of response saying that fuel was most significant factor hurting the person the most about the credit crunch (Figure 3). However there was spatial variation around the country with more respondents within Greater London saying it was either mortgage or rent, or food as shown in Figure 4.
Figure 3. Overall percentages for the Credit Crunch Survey.
Figure 4. Results of the Credit Crunch Survey Focused Around London (Note: the Colour represents the Most Frequent Response in the Postcode District).
2.2. Anti-Social Behaviour in East Anglia
The Credit Crunch Map has since led to BBC Look East, using the system to map peoples perceptions of anti-social behaviour.
Each respondent was asked “what problems do you face where you live?” Respondents had five options: drunken youths, noisy neighbours, boy racers, no problems, great community and no problems. The survey ran between 4th July 2008 and 12th September 2008. During this time 6902 responses were received. Figure 5 shows the overall percentages, with 33.7% saying drunken youths with the other categories broken down relatively evenly between 14 to 18%. Figure 6 maps the responses with drunken youths clustering around urban areas such as Norwich and Newmarket.
Figure 5. Overall Percentages for the Anti-Social Behaviour Survey.
Figure 6. Results of the Anti-Social Behaviour Survey Focused Around East Anglia (Note: the Colour represents the Most Frequent Response in the Postcode District, click here to see the map).
2.3. The Manchester Congestion Charge
There was a proposal for Manchester in introduce a congestion charge zone motorists pay to drive in and out of the city at peak times. The BBC North West Tonight program wanted people's reaction to the proposed Greater Manchester congestion charge, from within the city but also people who drive in from outside the region. As these people don't get a vote but may end up paying the charge (subsequently the people of Manchester said no).
People were asked the following question “If a congestion charge is introduced in Greater Manchester, along with significant investment in public transport, will you:” and then asked to select one of the following options: drive and pay the charge, drive at different times, use public transport/motorbike/bicycle, work or shop elsewhere, or I am not affected by these changes. The survey began on 14th October 2008. By the 10th December 2008, there were 14933 responses with 46.8% saying they would work or shop elsewhere (Figure 7). This online collaboration provided a unique picture of how well the proposal was going down across the north west of England as the map is updated every day (Click here to see the final map).
Figure 7. Overall percentages for the Manchester Congestion Survey.
3. Geodemographic Profiles of Respondents
While we only asked for respondents or their first part of their postcode, many entered their full postcode as can be seen in Table 1. We note that this in not a representative sample but it does provide an opportunity to further investigate who is responding to such surveys. To gain this understanding we use two geodemographic classification schemes. First, the Acorn classification from CACI which categorises neighbourhoods based on multidimensional socio-demographic attributes. The second being the e-Society geodemographic classification (Longley et al., 2008) which categorizes neighbourhoods based on their engagement with new information communication technologies.
For the analysis, index scores was calculated. An index score compares the over or under representation of a specific target variable against a base population (e.g. the national average). Where a score of 100 is the national average, 200 is double the national average and a score of 50 is 50% below the national average. From such analysis it is the middle and upper classes who are over-represented within the surveys as shown in Table 2, this potentially relates to demographics of the readers, listeners, and viewers Radio 4 and the BBC news. The over representation of E-business users in the E-society classification (Table 3) suggest many respondents are answering the questionnaire while at work. Furthermore the geodemographic profiles of responses to individual questions can also be explored as seen in Table 4. Across all demographic groups the biggest concern was fuel.
Table 1. Total Number of Respondents to Surveys and Number Who Entered Their Full Postcode.
Table 2. Index Scores of Respondents by Acorn Category Classification.
Table 3. Index Scores of Respondents by E-Society Group Classification.
Table 4. Percentage of Responses to the Credit Crunch Survey Broken Down by Acorn Category.
4. Discussion
This paper has demonstrated the potential of using GMap Creator and MapTube for near-real time spatial survey thus providing a resource to map the nations opinions to specific questions over space and time both statistically and geographically. The potential of this approach for gathering spatial information is enormous. For example, it could easily be used to gather other information such as fear of household burglary, the quality of primary school education and so on. We consider this in many senses this to be Web 2.0 and Neogeography in action.
However, the geodemographics of the respondents shows there is an inherit bias in who is answering the questions and there is the question to whether or not respondents are influenced by the maps before answering the questions. Further work is to explore how the maps evolve over time, as each response is time stamped and how this relates to news headlines. Additionally, we are currently exploring the geodemographic profiles of each survey in more detail. We have currently re-run the credit crunch with the BBC with slightly different options to the answer.
The question remains the same - "what single factor is hurting you most about the credit crunch?" But we decided to change the categories slightly:Mortgage or rent, Petrol, Food prices, Job security, Utility bills, or Not affected. This survey ran between 5th October 2008 and 3 February 2009 and has now closed. The final map can be viewed here. During this time we received 20,072 responses, which can be broken down as follows (Figure 8): Mortgage or Rent 11.05%, Petrol 4.7%, Food Prices 11.89%, Job Security 27.25%, Utility Bills 21.92%, and Not Affected 23.20%
The Return of the Credit Crunch on the BBC Site
Figure 8: Overall percentages for the Credit Crunch Survey
5. References
Gibin M, Singleton AD, Mateos P, and Longley PA. (2008) Exploratory cartographic visualisation of London using the Google Maps API Applied Spatial Analysis and Policy 1(2) pp85-97.
Hudson-Smith A, Crooks AT, Gibin M, Milton R, and Batty M (under review) Neogeography and Web 2.0: Concepts, Tools and Applications, Journal of Location Based Services.
Longley PA, Webber R, Li C, (2008) The UK geography of the e-society: a national classification Environment and Planning A 40(2) pp362-382.
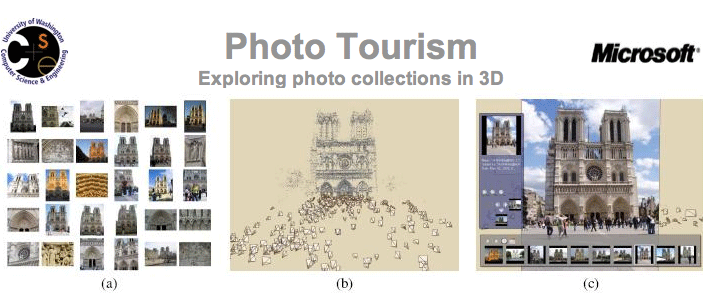
Noah Snavely, Rahul Garg, Steven M. Seitz of the University of Washington and Richard Szeliski of Microsoft Research have published a paper well worth reading entitled Finding Paths through the World's Photos in ACM Transactions on Graphics (SIGGRAPH 2008) [download the pdf]
The movie embedded below above details their talk at SIGGRAPH and provides a much more intriguing look at 3d construction from crowd sourced photos than the current Photosynth release:
In overview the concept is:
When a scene is photographed many times by different people, the viewpoints often cluster along certain paths. These paths are largely specific to the scene being photographed, and traverse interesting regions and viewpoints. We seek to discover a range of such paths and turn them into controls for image-based rendering. Our approach takes as input a large set of community or personal photos, reconstructs camera viewpoints, and automatically computes orbits, panoramas, canonical views, and optimal paths between views. The scene can then be interactively browsed in 3D using these controls or with five degree-of-freedom free-viewpoint control. As the user browses the scene, nearby views are continuously selected and transformed, using control-adaptive reprojection techniques.
Our latest working paper is now available for download - entitled Mapping for the Masses:Accessing Web 2.0 through Crowdsourcing.
Abstract
The paper first develops the network paradigm that is currently dominating the way we think about the internet and introduce varieties of social networking that are being fashioned in interactive web environments. This serves to ground our arguments about Web 2.0 technologies. These constitute ways in which users of web-based services can take on the role of producers as well as consumers of information that derive from such services with sharing becoming a dominant mode of adding value to such data.
These developments are growing Web 2.0 from the ground up, enabling users to derive hitherto unknown, hidden and even new patterns and correlations in data that imply various kinds of social networking.
We define crowdsourcing and crowdcasting as essential ways in which large groups of users come together to create data and to add value by sharing. This is highly applicable to new forms of mapping. We begin by noting that maps have become important services on the internet with nonproprietary services such as Google Maps being ways in which users can fashion their own functionality. We review various top-down and bottom-up strategies and then present our own contributions in the form of GMapCreator that lets users fashion new maps using Google Maps as a base.
We have extended this into an archive of pointers to maps created by this software, which is called MapTube, and we demonstrate how it can be used in a variety of contexts to share map information, to put existing maps into a form that can be shared, and to create new maps from the bottom up using a combination of crowdcasting, crowdsourcing and traditional broadcasting.
The paper concludes by arguing that these developments define a neogeography which is essentially ‘mapping for the masses’.
Mike Goodchild of the University of California, Santa Barbara is one of the key commentators on virtual geographic environments (VGE’s). Below is a note based summary of Mike's presentation at the International Conference on Developments in Visualization and Virtual Environments in Geographic Information Science at The Chinese University of Hong Kong: Institute of Space and Earth Information Science – these are interesting times in the world of geography and visualization:
VGE’s are replica of real geographic environments and as such Mike rules out systems such as Second Life. VGE’s are complex and therefore slow and tedious to build. A database of approximately 3PB would be required to represented every human structure on earth with over 10% of UDP over the next 10 years. As such this is the problem, the cost is prohibitively high.
Strategies to limit cost on such a project – a true virtual earth – can be to:
1) Limit level of details 2) Resort to Geo-typical not geo-specific detail 3) Rely on Data acquisition technologies
Geo-typical facades can be used to rapidly construct virtual cities, this is of note when you are talking about every human made structure on earth.
The potential solution is:
Volunteered Geographic Information (VGI)
A phenomena of the past few months in the geographic world – user generated content, also known as Collective Intelligence, Crowd Sourcing, Asserted Information and finally Neogeography. This amounts to the employment of millions of private citizens for no financial award – essentially Wikinomics. Openstreetmap.org is a good example with all data contributed by volunteers, hand in hand are mashups in Google Earth, Maps and the 3D Warehouse in general – all user contributed geographic content.
This is made possible by the rise of Web 2.0 and Web Search Engines which are under estimated in their contribution. The ability to find geographic information is arguably as important as creating it.
With this information comes of course a change of accuracy, in general with the introduction of Google Earth and with it being the reference point for information input we can expect accuracy to be within 10 metres. This s a notable drop compared to GPS based data input or by more professional means. So relying on Google Earth is perhaps not the best way to proceed as an information base, it however one of the main tools of Neogeography.
National mapping agencies can be seen as being in decline which is perhaps why user generated content is on the rise. Combined with lowering costs of atmospheric sensors allowing small cheap devices to be built. Digital Dust is a unique term of small low cost digital sensors.
The Spatial Web is created by objects that know and report where they are – a network created by Digital Dust. In general there are three types of sensors networks, fixed, carried and human beings themselves. Bringing this back to Web 2.0 the combination of Digital Dust, and Human Beings - Citizen Science.
Citizen Science are networks of amateur observers who are possibly trained and skilled. This distinguishes general user generated content as content is sent in but partially aware personal.
In essence this brings VGI’s and ultimately a fully mapped, 3D digital earth down to user generated content - a Neogeographic World. Of note however is a reliance on technology and peoples motivation for collecting data. Self promotion is one part, every submitted piece of information can be user tagged and ownership maintained, a difference to traditional national mapping agency techniques.
VGI makes a very significant contribution on geography with a local focus. There are questions of trust, preservation and accuracy. Any person can put a name on a map, location or place, we are moving away from authority in the role of individuals in creating geographic information.
Is VGI a solution to the VGE construction problem? VGI is still predominately two-dimensional, but it holds huge potential.