CityDashBoard TalesofThings MapTube
Qrator Tutorials About Digital Urban
MRes ASAV SurveyMapper Contact Us
Showing posts with label MapTube. Show all posts

2009-10-16

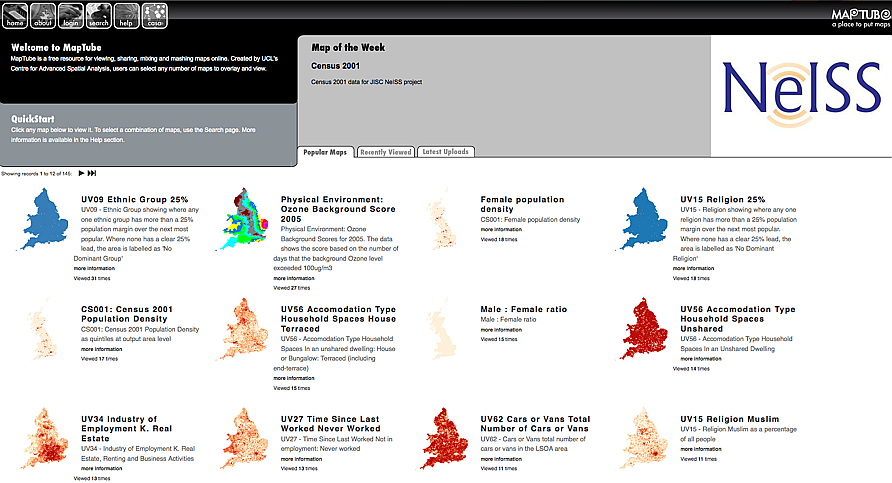
MapTube: Now with 145 Census Maps

As part of work on the JISC funded National e-Infrastructure for Social Simulation project, CASA has put online 145 census maps. Running within the MapTube system, each map can be mixed and matched with any other map to create unique overlays.


The system was developed as a quick and easy way to view maps of census data without having to go through a slow cumbersome list of drop down boxes only to be left with a .shp or .csv file to download. Future versions will include direct links to the raw data and the possibility to directly query the fields.

Of note in the development cycle of MapTube, each map is now created dynamically, this is in preparation for a new 'mapping service' which will be open to beta testers in early 2010.

You can take a look at the maps via http://www.maptube.org/census/

2009-08-06

Population Density: Google Maps Census System Preview

At the moment here at CASA we are working on a phase one deliverable of a new grant entitled NeISS - National e-Infrastructure for Social Simulation. Funded by the JISC as part of its Information Environment Programme it will provide a platform to meet the demand for powerful simulation tools by social scientists, public and private sector policymakers. Social Simulation is an expanding field due to its forecasting applications for scenarios in transport, housing, education, healthcare etc.

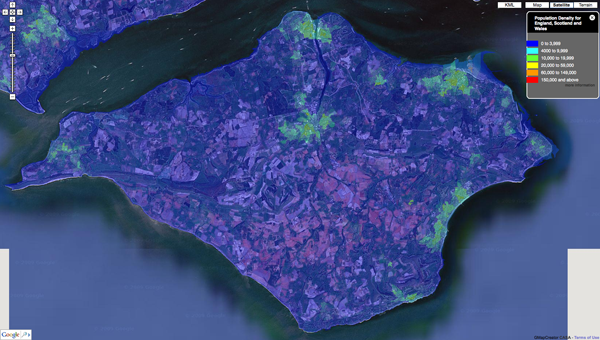
Our first of many outputs is to visualize the UK Census data via MapTube and we thought we would share some of our first results as they make for quite intriguing images - such as the screen grab below detailing Population Density of the Isle of Wight:


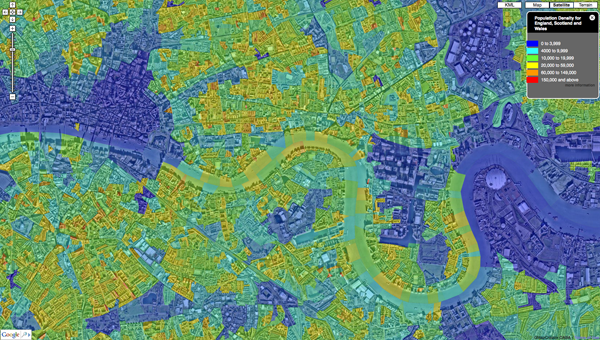
The work is ongoing with the ability to 'click' on areas and view the underlying data as well as data streaming and varying levels of detail all forthcoming. Countywide, zoomable down to local level Cenus data is hard to come across, for a quick view is provides quite a good way to identify pattens in the urban landscape. Below is Central London:


Our back end system under development means that the output is not limited to the UK Census, it would be interesting to make this a global tool, more on this in future posts...

You can see our sample map of Population Density direct via MapTube.

2009-05-21

GMapCreator: Clickable Thematic Maps Preview


Over at the GENeSIS blog Richard Milton of CASA has put up a sneak preview detailing some of the functionality of the latest GMapCreator. Traditionally clickable maps have been built using a server and database to translate the click on the client into a geographic area using point in polygon and then sending the query data back to the client. This method doesn’t scale when you have limited server resources and are looking to handle high numbers of hits, for example with the Mood Maps that we’ve been doing recently. An alternative solution is to build feature coded tiles and let the client handle most of the work displaying the data.

In short, its clickable Google Maps at a large scale without any slow down compared to other solutions, take a look at the GENeSIS blog for more info...

This build will be integrated into our MapTube site as soon as ready for wider use. As a side note MapTube is now includes the option to view your data on top of OpenStreet Map layers.

2009-04-08

MPs' Expenses Map on MapTube

In recent weeks the level of expenses claimed by Member of Parliament in the United Kingdom has been hitting the headlines. Thanks to MapTube here at CASA it is now possible to view a map of the UK detailing MPs' expenditure from 1 April 2007 to 31 March 2008, the map is coloured to show the total amounts being claimed by MPs in each constituency.

A new feature to MapTube is the ability to include clickable data ontop of the map, each 'i' link contains more detailed information about the rules governing MPs' allowances and how much can be claimed for in each of the 8 categories.

The total expenditure for all 646 MPs is £86,781,20;

The mean is £134,544.5;

The maximum claim was for £167,306 by Ann Keen of Brentford and Islewort;

The minimum claim was for £40,433 by Philip Hollobone of Ketterin;

The data for the Crewe and Nantwich constituency (Edward Timpson) and the Glenrothes constituency (Lindsay Roy) are missing from the original dataset.

Note the information does not show members' travel expenses, which are in a separate table to the allowance expenditure.

You can view the map direct via MapTube.

2009-01-16

Mapping the Credit Crunch - MapTube on the BBC


With a slightly different hat on from our normal urban visualisation work we also run our National Centre for e-Social Science grant here at CASA. One of the biggest successes of the grant has been MapTube which is based on our GMap Creater software developed by Richard Milton here in the lab.

An up and coming feature of MapTube is the ability to carry out near real-time geographic surveys, the latest of which is the new Credit Crunch Survey by the BBC Radio 4 PM show.

Key to public surveys and getting enough inputs to get a nationwide view is exposure, thankfully our latest survey is currently featured on the main BBC frontpage, significantly increasing traffic and thus survey results.

See the BBC iPM page for full details on the survey.


On a more regional level we are also running a survey to map peoples views on job security in association with BBC Look East. See the BBC Look East page for more details.

If you would like to know more take a look at our online publications page as we talk about MapTube in a number of the latest papers..

2008-10-23

MapTube: Geographic Surveys - BBC Manchester and Radio 4

At the moment we have two geographic surveys running with the BBC. Embedded below is the BBC Manchester Congestion Charge Survey:


Thanks go to our funders on the project - the National Centre for e-Social Science at Manchester University for setting this one up. Its nice to see maps used as part of a news item, MapTube was developed as part of our GeoVue grant at CASA (home of digital urban) to develop a free and easy way to share, mix and match professional maps online via the Google Maps interface.

Secondly Radio 4's PM show is running an update to their Credit Crunch Survey - see the iPM post Credit Crunch: The return of the map.

Finally, although not a survey, MapTube also has a new map online detailing the money invested by UK councils following the collapse of the Icelandic banks.


View the Iceland Banks Money Invested Map
.

Take part in the BBC Radio 4 Credit Crunch Survey.

Have your say on the Manchester Congestion Charge via BBC North West.

2008-08-29

Mapping for the Masses: Accessing Web 2.0 through Crowdsourcing

Our latest working paper is now available for download - entitled Mapping for the Masses: Accessing Web 2.0 through Crowdsourcing.

Abstract

The paper first develops the network paradigm that is currently dominating the way we think about the internet and introduce varieties of social networking that are being fashioned in interactive web environments. This serves to ground our arguments about Web 2.0 technologies. These constitute ways in which users of web-based services can take on the role of producers as well as consumers of information that derive from such services with sharing becoming a dominant mode of adding value to such data.

These developments are growing Web 2.0 from the ground up, enabling users to derive hitherto unknown, hidden and even new patterns and correlations in data that imply various kinds of social networking.

We define crowdsourcing and crowdcasting as essential ways in which large groups of users come together to create data and to add value by sharing. This is highly applicable to new forms of mapping. We begin by noting that maps have become important services on the internet with nonproprietary services such as Google Maps being ways in which users can fashion their own functionality. We review various top-down and bottom-up strategies and then present our own contributions in the form of GMapCreator that lets users fashion new maps using Google Maps as a base.

We have extended this into an archive of pointers to maps created by this software, which is called MapTube, and we demonstrate how it can be used in a variety of contexts to share map information, to put existing maps into a form that can be shared, and to create new maps from the bottom up using a combination of crowdcasting, crowdsourcing and traditional broadcasting.

The paper concludes by arguing that these developments define a neogeography which is essentially ‘mapping for the masses’.

Download the paper as a pdf (1.8Mb)

Those interested may also like to check out our full working paper series, including the recent The Renaissance of Geographic Information: Neogeography, Gaming and Second Life.


2008-07-24

MapTube adds KML/KMZ into the Neogeography Mix

MapTube has just entered a new beta phase allowing both kml and kmz files to be linked in.

Adding kml into the mix allows any map created via MyMaps to be viewed on MapTube and layered with any other map on the system. Its in beta but linking is easy, simply register and then rather than point us to your .xml file, simply point us to any .kml or kmz. Add in a description and click save, the map is now part of MapTube and ready to be viewed alongside any of the other converted .shp, .csv, kml or kmz files.


http://www.maptube.org - select 'latest uploads' and our first test kml of the Top 25 Web 2.0 Companies Locations should be viewable, the file is linked in direct from Google MyMaps. The ability to pull in kml form other sites, such as MyMaps allows for an interesting mix and match of both of neo and professional geography side by side.

Note MapTube comes out of CASA, the home of digital urban. Software to convert ESRI .shp files to Google Maps and MapTube is available free of charge via the MapTube site once you register, registration is free.

We will have more examples and updates over the coming weeks.

2008-07-15

London Teenage Murders From 2007 to Date, Knife Assaults and Regeneration Areas: Mapped - A Clear Pattern Emerges

The rise in knife attacks and the number of teenagers murdered has been sadly dominating the news for a while now in the UK. Data on such incidents is hard to come by as the police do not provide open access to incident locations, despite it perhaps being in the public interest.

As such it is left to the public at large to fill in the gaps - in the case of teen killings, MapMan has created a map of teenagers murdered in London since 2007. Created using Google MyMaps the list has been compiled via various websites (such as http://www.capitalradio.co.uk/article.asp?id=532062) with street names identified in related press articles and plotted on the map. Actual position within the street will not be accurate, but the street names themselves should be. Note the map relates to all murders, not just knife related incidents.

Using MapTube the map can be overlaid with other data sets, such as a map uploaded detailing assault using a knife or sharp objects extracted from all hospital admissions (2007). The map is based on data with a cause code of ICD-10 X99 (assault by sharp object) and excludes all codes that may indicate accidental injury (ICD10 – W25, W26), self inflicted (ICD10 – X78) and undetermined intent (ICD10 Y28).

Figures are directly age standardised per 100,000 population with CI’s - Actual counts were excluded in the map due to disclosure surrounding low numbers. By overlaying the two maps you begin to get a picture of the extent of knife crime and the number of murders in London.

Each link is clickable for more information. Such data should really be available via either the http://www.london.gov.uk/ or http://www.met.police.uk/ along with other locations of crime in the city. It may be alarming to see such incidents mapped but this is the city we live in and the public should have a right to view exact locations of crime in their neighbourhoods.

If you then use MapTube to add in Regeneration Areas within London a clear pattern between teenage murders and deprivation emerges:


You can view the map direct via MapTube. The map can also be viewed against other indicators such as ethnic population, barriers to housing or any of the other 47 maps relating to London. KML maps will be fully integrated into the site over the next few weeks.

The work also ties in with our near real-time geographic survey in association with BBC Look East on Anti Social Behavior (using the same system as our BBC Radio 4 Credit Crunch Map) we will have more on that in future posts.

2008-06-30

Global McDonald's Price Map: BurgerNomics

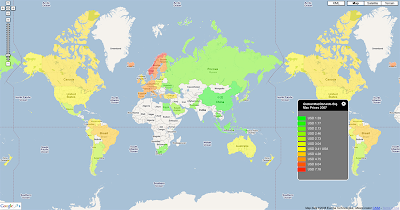
We have been adding some new maps recently to MapTube, our most recent being the global price of Big Mac's around the world.

Based on the Big Mac Index which according to the Wiki was "introduced by The Economist in September 1986 as a humorous illustration and has been published by that paper annually since then. The index also gave rise to the word burgernomics.

One suggested method of predicting exchange rate movements is that the rate between two currencies should naturally adjust so that a sample basket of goods and services should cost the same in both currencies. In the Big Mac Index, the "basket" in question is considered to be a single Big Mac burger as sold by the McDonald's fast food restaurant chain.

The Big Mac was chosen because it is available to a common specification in many countries around the world, with local McDonald's franchisees having significant responsibility for negotiating input prices. For these reasons, the index enables a comparison between many countries' currencies. Some menu items are market specific, which would hinder a comparison, if used. Still other menu items are specially priced, such as the dollar menu in many U.S. restaurants consisting of sandwiches and other items that cost $1".

Mapping the index provides and instant guide to prices around the world - it makes interesting viewing, China is by far the cheapest place for a BigMac, visualised all thanks to the increasingly easy ways to view and create geotagged information.

You can View the Map yourself via MapTube, data thanks to The Economist.

See the Big Mac Index Wikipedia page for more information.

2008-06-04

Announcing MapTube Local: London Edition


CASA is pleased to announce the beta release of MapTube London - http://www.maptube.org/london. The site provides a quick and easy way to visually compare various datasets about the city. Working in a similar vein to our main MapTube site the London version focuses data on the local area, making it easy for interested users, councilors, politicians to quickly and easily view and compare maps.

Software is provided free of charge for those holding data on the city to quickly and easily convert to the Google Maps format, ready for inclusion on MapTube London. The London Boroughs and the Greater London Authority hold vasts amounts of data, now there is a quick way for them to share and more importantly visually compare data city wide.

To overlay any number of maps simply click the 'Search' button and then the 'Plus' icon next to each set of visual data. Once selected click 'View Map' and then you can fade in/out and change layers to visually compare.


Pictured above is a prime example, selecting the map for 'Bangladesh Population' and 'Barriers to Housing and Services' illustrates that the majority of Bangladesh's in London live in areas where access to both housing and services is limited.

At present we have 47 maps on the site covering issues such as Crime, Population, Ethnic Clustering and Building Volume, amongst other, as boroughs, councils and authorities get involved we hope this number will rise.

As a beta site we are making additions over the next few weeks, for example the ability to overlay KML will appear on the next few days allowing Google's MyMaps to be combined with MapTube London - the site is non-profit making from the Centre for Advanced Spatial Analysis, University College London and we hope it provides a new and innovative way to view the city.

View MapTube London

View the Global MapTube site.

2008-05-23

Mapping the Credit Crunch: Mapping the UK's Mood with Radio 4

Over the last few weeks Radio 4's PM show has been carrying out a survey on the UK's fears on the Credit Crunch. In association with our MapTube site at CASA listeners were asked for the first part of their postcode and to answer the following question:

What single factor is hurting you most about the credit crunch?

Please select one of the answers below:

Mortgage or Rent
Fuel
Food Prices
Holidays
Other
The Credit Crunch is not affecting me

We generated a new map every 30 minutes, providing an up to date view of the nations mood.


The results are fascinating, with over 22,000 responses 49% were most worried about fuel price with food running in second at 19%. The interesting part for us is to view these results both statistically and geographically as the results come in, to date the breakdown is as follows:


You can view the map at http://www.maptube.org with full details on the BBC's iPM page - of note is the rural/urban split with urban areas being notably more worried about mortgage or rent payments compared to other areas of the UK.

2008-05-19

Free Google Map Creator Software: MapTube from CASA

MapTube, the new mapping site from our lab CASA at University College London to view, overlay, mix and match choropleth maps now includes a free creation tool.

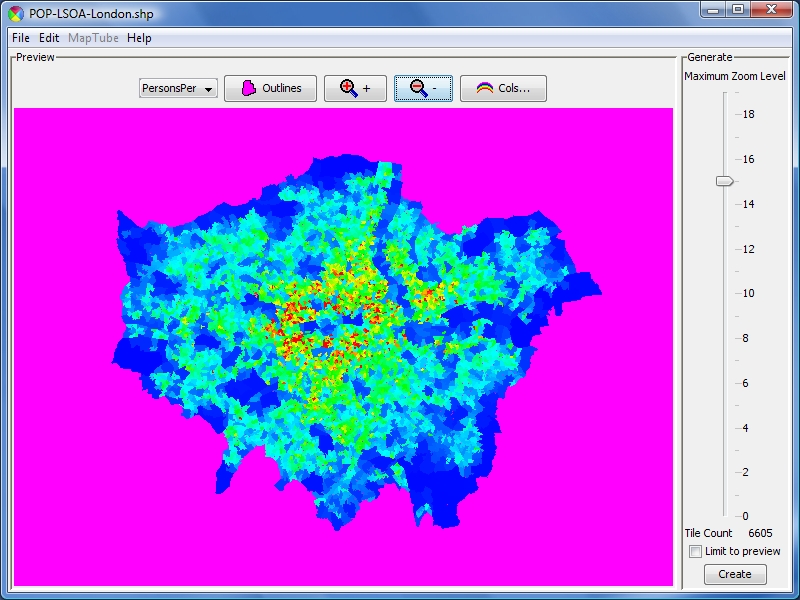
Google Map Creator provides a quick and free way to convert .shp or formated .csv for viewing in Google Maps and MapTube - allowing datasets to be quickly and easily shared and visually compared against any other data on MapTube. In short it is perfect for local councils, government organizations, academics and general users who want to view and share their data in the easiest way possible.

Unlike the Google Maps API method for displaying points, lines and polygons, Google Map Creator renders the map information as a series of raster image tiles (256x256 pixels) accordingly to the level of zoom required. This protects the raw data, easing issues of copyright and data sharing while allowing any dataset to be mixed, matched and visualised with any other data on MapTube.

Before uploading to MapTube, maps need to be created from shapefiles using the Google Map Creator tool and placed on the web. Maptube takes a link to this location and creates a new map reference from the information found there.

Quickstart - How to Create a Map for MapTube
  • Create the map with the Google Map Creator and save the settings xml file.

  • Copy the tile directory and xml settings file to a web server.
  • Log in to MapTube and choose Add A New Map.
  • Copy the url of the settings xml file into the XML URL box and click 'Test'.
  • Fill in the rest of the information on the page and click on 'Submit' to upload the map.
We will be featuring a MapTube Map of the Week - currently The Credit Crunch from our work with BBC Radio 4 - on Digital Urban and while its difficult to be unbiased about MapTube (as we are part of it) it is a notable change in the ability to view, share and visually analyse geographic data online....

To start making maps simply login to http://www.maptube.org

See http://www.maptube.org/help-createmap.aspx for full details and as ever any thoughts are welcome.

2008-05-13

Welcome to MapTube from CASA: A Place to Put Maps

MapTube is a new site from our lab, the Centre for Advanced Spatial Analysis at University College London. Put simply it is a place to share, mix and mash maps with a nod towards professional map makers rather than the more widely seen 'MyMaps' type applications.


The main principle of MapTube is that shared maps can be overlayed to compare data visually. For example, to see a map of the London Underground overlayed on top of a map of population you simply go to the search page and enter the keywords "tube" and "population". Then click on the two relevant maps to add them.

In this way any combination of data can be quickly and easily visually compared. The maps are created using our free of charge software - GMap Creator, a new version launches this week allowing any ESRI .SHP file or Formatted .CSV to be converted and used on MapTube.

For the last few weeks a back end section of the site has been used by BBC Radio Four's PM Show to create a mood map of the credit crunch in the UK. Radio 4 listeners have been inputting their postcode and answering a simple question on the credit crunch to automatically create a map of the nations mode. This indicates a future direction of the site with both freely available software and server based map applications, all subsequently viewable against any other local, national or global dataset on the site.

It is early days but we see MapTube as an exciting way forward in sharing and viewing maps online.....

Try it out yourself at http://www.maptube.org