























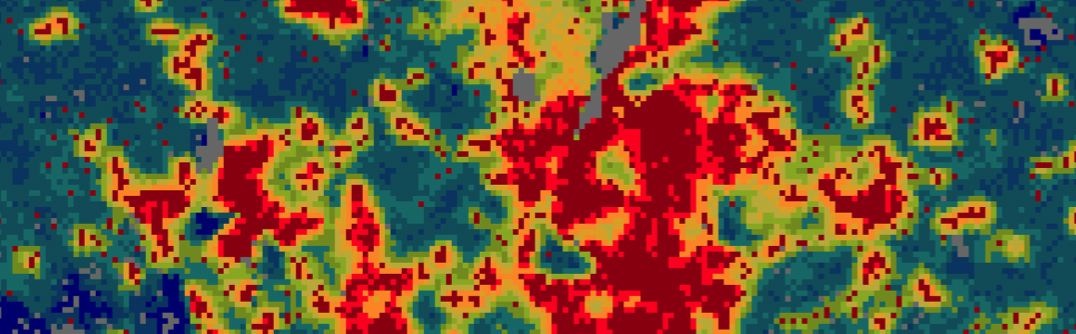
 Sanna Iltanen from the EDGE Laboratory for Architecture and Urban Research (Tampere University of Technology) who is currently a visitor at our lab gave a talk the other day entitled "Experiments with SLEUTH-model". She discussed the SLEUTH model, the input data needed to initialize the model, its calibration and explored some simulation results from different land-use policies in the Helsinki and Turku city regions of Finland.
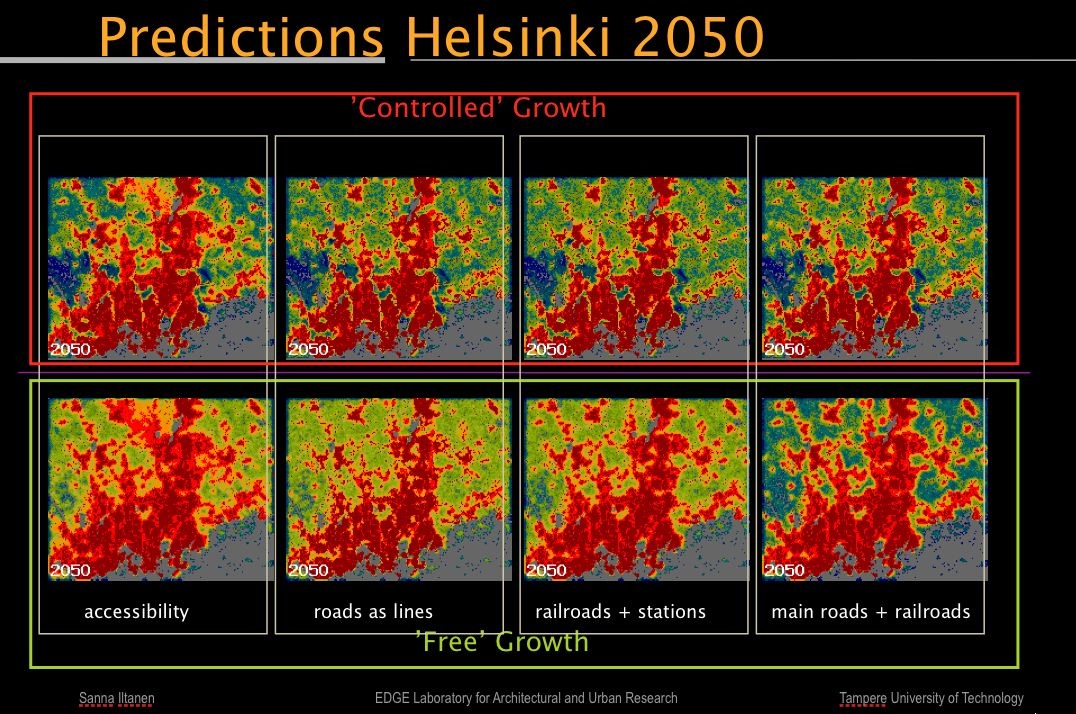 The SLEUTH model is a tightly coupled, modified cellular automaton model of urban growth (and other land class change) which has been applied to over 100 cities and regions over the last decade (click here to see some of them). For example, it has been used to explore future land use patterns under different policy scenarios in the Washington-Baltimore metropolitan area.
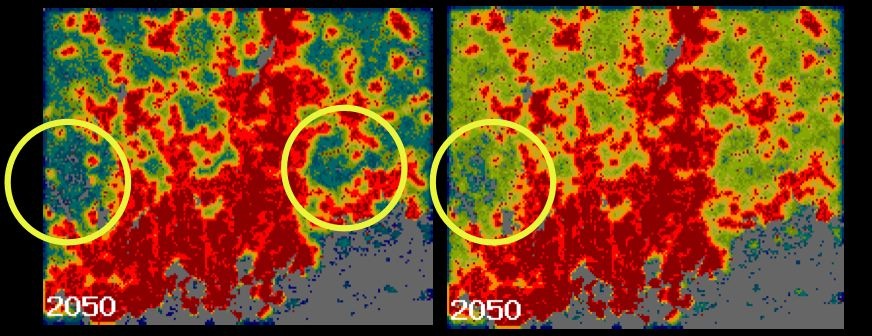 The name SLEUTH was derived from the simple image input requirements of the models: Slope, Land cover, Exclusion, Urbanization, Transportation, and Hillshade.NASA have also used the model to look at the growth of Washington. The model was applied to 23,700 square kilometers (9151 sq. miles) of the Washington-Baltimore metropolitan area. The initial aim was to simulate the impact of future policy scenarios on the area and Chesapeake Bay watershed.
You can download her Sanna's talk from here, thanks go to gisagents.blogspot.com for the info and background on the SLEUTH model.
Showing posts with label Urban Growth. Show all posts
Showing posts with label Urban Growth. Show all posts
2009-06-18
Urban Generator: The SLEUTH Model


2009-02-03
Google Earth 5.0 Includes Historical Imagery - View Urban Growth/Sprawl
The latest update to Google Earth - Version 5.0 - includes the ability to view historical data according to location. In short it allows you to zoom into and area and view aerial imagery from the past. The short clip below details growth in a suburb of Las Vegas:
Google Earth 'Historical Imagery' Timeline from digitalurban on Vimeo.
While the majority of the imagery is currently US based, with some areas back as far as 1950, London can be viewed from 1999 onwards and other parts of the UK from 2001. It does make some interesting comparisons and could prove invaluable for the teaching of urban growth and urban sprawl.
The two images below are a quick example we found of new road and housing construction:
 2008
2008 Change is obviously not limited to urban areas, it can also be of specific use in explaining changes to our physical geographic environment. The movie below by the United Nations Environmental Programme, highlights the Aral Sea in Central Asia, where irrigation and water diversion has led to a dramatic shrinking of the lake beginning in the 1960s and continuing today.
This is an extremely valuable update to Google Earth and one that will have notable impact in the communication and teaching of both physical and human geography.
Take a look at the Google Earth Blog for more features included in Google Earth 5 and Google's Lat Long Blog for more in historical imagery.
Google Earth 'Historical Imagery' Timeline from digitalurban on Vimeo.
While the majority of the imagery is currently US based, with some areas back as far as 1950, London can be viewed from 1999 onwards and other parts of the UK from 2001. It does make some interesting comparisons and could prove invaluable for the teaching of urban growth and urban sprawl.
The two images below are a quick example we found of new road and housing construction:
2005
 2008
2008 Change is obviously not limited to urban areas, it can also be of specific use in explaining changes to our physical geographic environment. The movie below by the United Nations Environmental Programme, highlights the Aral Sea in Central Asia, where irrigation and water diversion has led to a dramatic shrinking of the lake beginning in the 1960s and continuing today.
This is an extremely valuable update to Google Earth and one that will have notable impact in the communication and teaching of both physical and human geography.
Take a look at the Google Earth Blog for more features included in Google Earth 5 and Google's Lat Long Blog for more in historical imagery.
Subscribe to:
Posts (Atom)